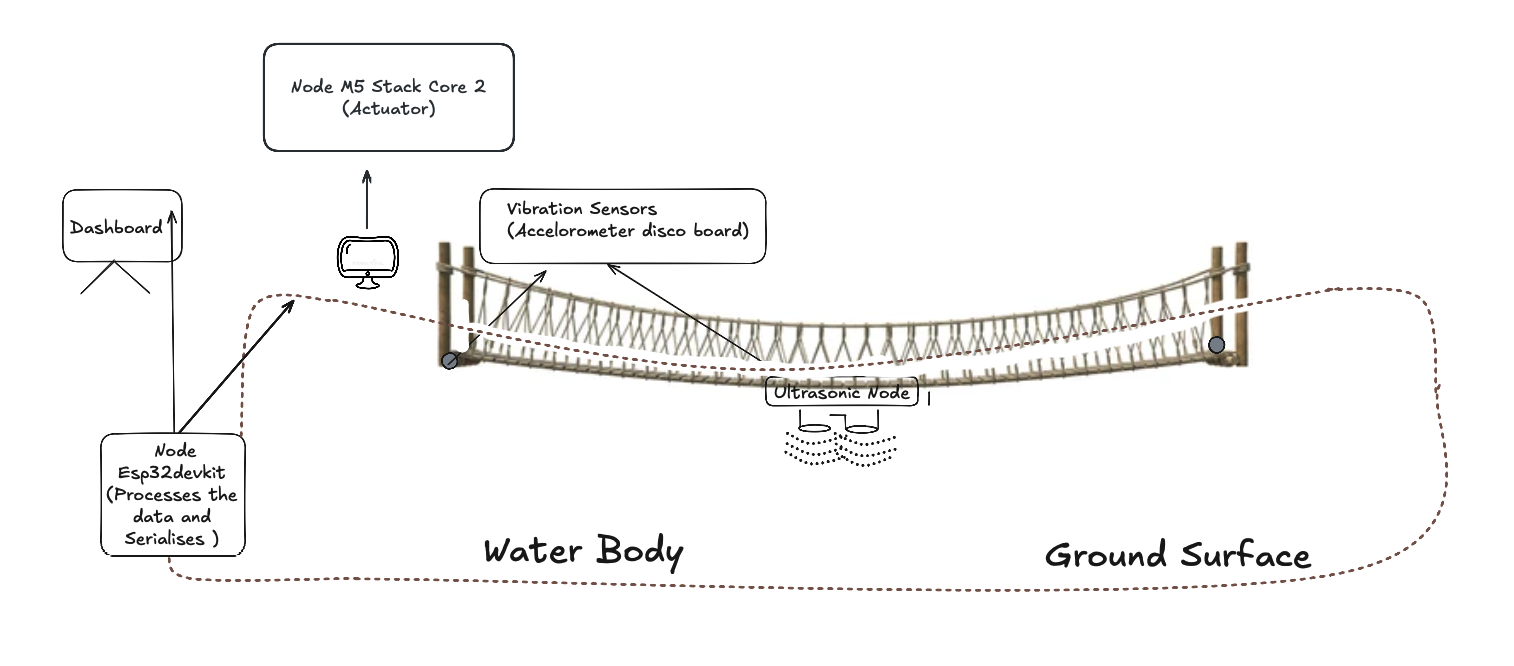
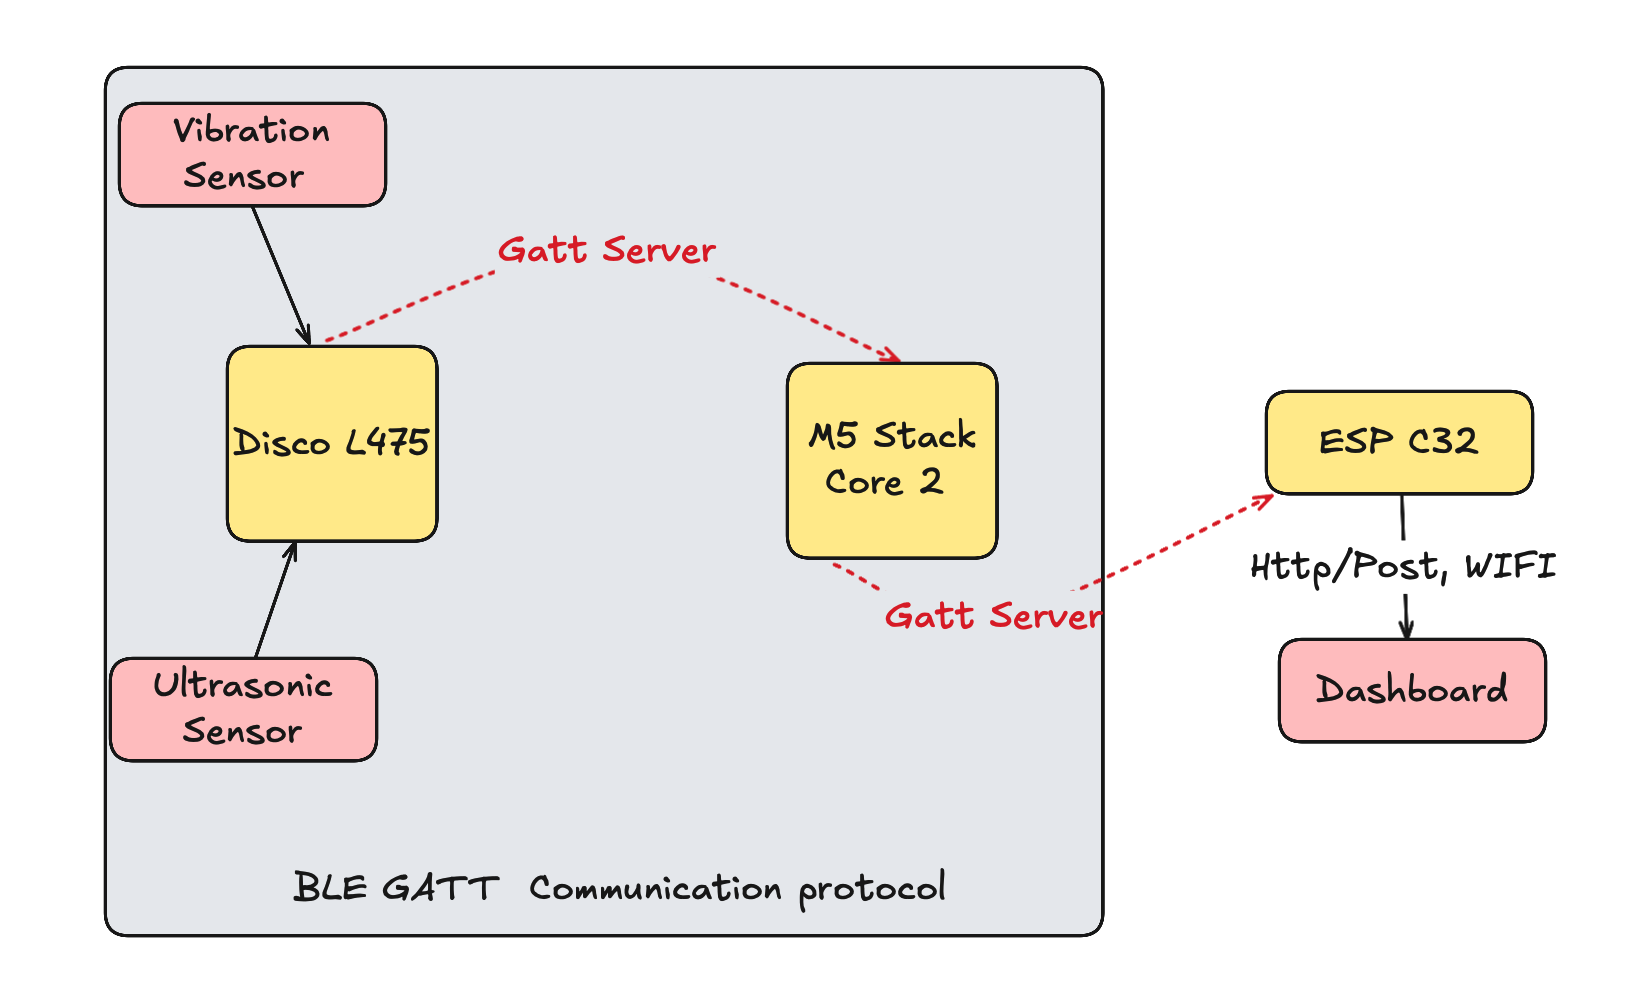
The project aims to develop an intelligent bridge monitoring system for suspension bridges that span wide gaps, such as those over valleys or rivers. A DISCO board equipped with sensors collects data on bridge vibrations and the distance from the bridge sag to the riverbed or the ground—an important metric, as rising water levels can pose structural risks. An ultrasonic sensor node is mounted at the center-bottom of the bridge, while accelerometer sensors are integrated with the DISCO board at the anchor point. The DISCO board collects sensor data and wirelessly transmits it to an ESP32 base station using the BLE protocol. The ESP32 performs JSON serialization and forwards data to an M5StackCore2 device, which applies Kalman filtering for data processing and serves as the actuator displaying bridge status warnings and boom gate control signals (open/close). A web-based dashboard provides real-time visualisation of the bridge's condition through the ESP32 gateway. Figure below illustrates the project idea in form of the diagram.
The system follows a hierarchical architecture depicted in the pyramid below:
                        ▲
                       / \
                      /   \
                     /     \
                    /       \
                   /         \
                  /           \
                 /    Data     \
                / Visualization \
               /     Layer       \
              /-------------------\
             /                     \
            /    Processing &       \
           /    Decision Layer       \
          /---------------------------\
         /                             \
        /       Communication Layer     \
       /---------------------------------\
      /                                   \
     /          Data Collection Layer      \
    /---------------------------------------\
Layer Description:
- Data Collection Layer: DISCO board with integrated accelerometer and ultrasonic sensors form the foundation, gathering raw data about bridge conditions.
- Communication Layer: BLE protocol handles transmitting sensor data from DISCO board to ESP32 base station.
- Processing & Decision Layer: ESP32 performs JSON serialization and data forwarding, while M5StackCore2 applies Kalman filtering, determines bridge safety status, and displays warnings.
- Data Visualization Layer: Grafana dashboard presents processed data through ESP32 gateway in an intuitive interface for monitoring and assessment.
System Operation Scenario: Consider a suspension bridge spanning a river prone to seasonal flooding. The DISCO board continuously collects vibration data that shows increased oscillation at the central span and ultrasonic distance measurements detecting decreasing bridge-to-water clearance. This raw sensor data is transmitted via BLE to the ESP32 base station, which serializes the data into JSON format and forwards it to the M5StackCore2. The M5Stack applies Kalman filtering to reduce noise and correlates the increasing vibration with the decreasing sag distance, triggering a "WARNING" status display on its screen. The system shows boom gate control signals (OPEN/CLOSE) on the M5Stack display while the ESP32 simultaneously updates the dashboard with visualizations of the affected parameters, allowing maintenance teams to respond before critical thresholds are reached.
| Deliverable | Description | KPI | Measurement Method | Success Criteria |
|---|---|---|---|---|
| Functional Monitoring System | Complete end-to-end system that collects, processes, and visualizes bridge health data | System uptime > 90% | Continuous monitoring of system availability during testing period | System remains operational for at least 90% of the 2-week testing period |
| Accurate Measurement System | Precise measurements of bridge vibration parameters and sag distance | Sensor accuracy < 5% error | Comparison with calibrated reference instruments | Measurements within 5% of reference values across multiple test scenarios |
| Wireless Communication Network | Reliable data transmission between DISCO board, ESP32, and M5StackCore2 | Packet loss < 5% | Analysis of sent vs. received packet counts | Successfully transmit over 95% of data packets during operation |
| Status Display & Warning System | M5StackCore2 display showing bridge status and boom gate control signals | Response time < 3 seconds | Timing from safety alert to status display update | Display consistently updates within 3 seconds of safety status change |
| Web Dashboard | User interface displaying real-time bridge status and historical data | Dashboard update rate < 5 seconds | Measurement of time between data changes and UI updates | Dashboard consistently reflects new data within 5 seconds |
| System Documentation | Comprehensive technical documentation including setup guides, API references, and maintenance procedures | Documentation completeness score > 85% | Evaluation against documentation checklist | Documentation covers at least 85% of system functionality and operations |
| Test Results | Validation of system performance under various conditions | Test coverage > 90% | Analysis of test scenarios vs. requirements | Tests validate at least 90% of system requirements |
-
Sensors:
- Accelerometer: Integrated with DISCO board, measures x, y, z-axis vibrations at anchor points.
- Ultrasonic Sensor (HC-SR04): Integrated with DISCO board, measures sag distance at the bridge center.
-
Processing & Display:
- M5StackCore2: Applies Kalman filtering, processes sensor data, displays bridge status and boom gate control signals.
-
Communication Nodes:
- DISCO Board: Collects sensor data from integrated accelerometer and ultrasonic sensor.
- ESP32 DevKit: Receives BLE data, performs JSON serialization, and enables dashboard communication.
-
Web Server & Dashboard:
- Wi-Fi-enabled through ESP32, displays:
- Vibration trends
- Sag distance
- Bridge status
- System health
- Wi-Fi-enabled through ESP32, displays:
- ESP32 DevKit (Base Node & Gateway):
- Receives BLE packets from DISCO board.
- Performs JSON serialization of sensor data.
- Forwards processed data to M5StackCore2.
- Serves as gateway for web dashboard communication.
- DISCO Board (Sensor Collection Node):
- Collects accelerometer and ultrasonic sensor readings.
- Formats timestamped data packets.
- Transmits raw sensor data via BLE to ESP32.
- Accelerometer Integration:
- Integrated with DISCO board for continuous vibration monitoring.
- Computes vibration magnitude in real-time.
- Packages timestamped data for BLE transmission.
- M5StackCore2 (Processing & Display Unit):
- Receives JSON-formatted data from ESP32.
- Applies Kalman filtering for noise reduction.
- Implements bridge safety evaluation algorithm.
- Displays bridge status and boom gate control signals on integrated screen.
- Web Dashboard (Grafana):
- Receives data through ESP32 gateway
- Real-time and historical data visualization
- Visual indicators for:
- Sag level
- Vibration intensity
- Bridge status
- System health
- Accelerometer: Integrated with DISCO board, measures bridge vibrations (x, y, z).
- Ultrasonic Sensor: Integrated with DISCO board, measures vertical distance from deck to ground/river.
- Protocol: Bluetooth Low Energy (BLE) communication using GATT (Generic Attribute Profile) in a server-client architecture
- Topology: Star (ESP32 as hub, M5StackCore2 as processing endpoint)
- Message Format: JSON (handled by ESP32)
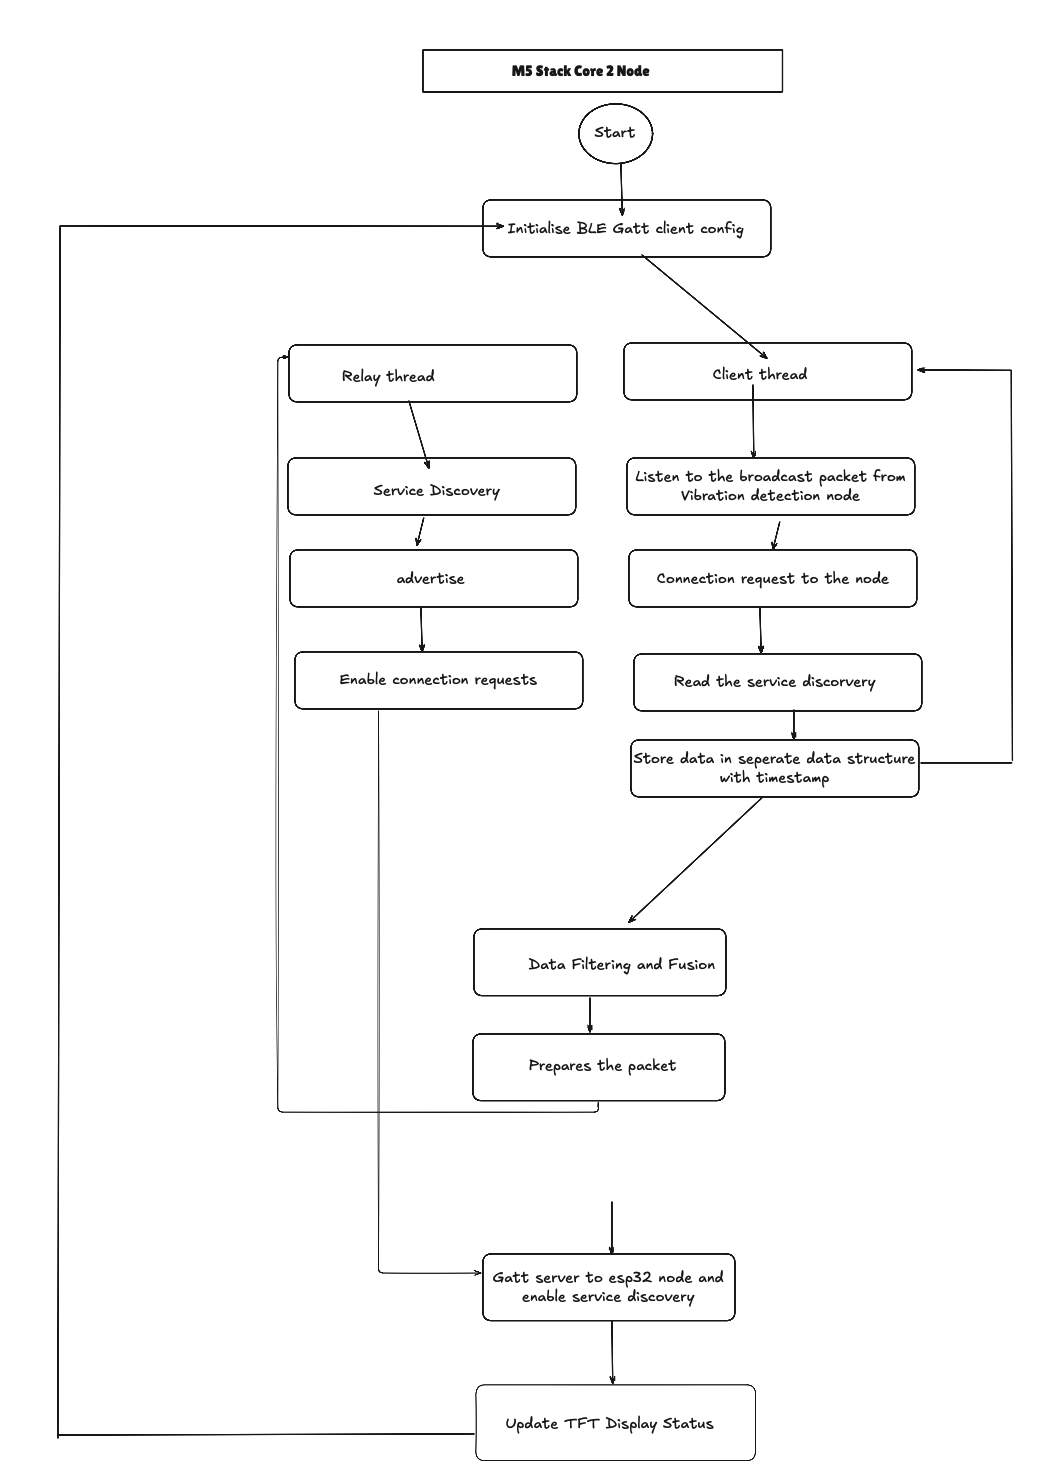
The system uses a structured messaging protocol for communication between components. The diagram below illustrates the updated message flow and format:
┌─────────────┐                 ┌─────────────┐                 ┌─────────────┐
│             │   1. Collect    │             │   2. BLE        │             │
│ DISCO Board │ ─────────────→  │ Integrated  │ ─────────────→  │    ESP32    │
│             │   Sensor Data   │  Sensors    │   Transmission  │   Gateway   │
│             │                 │ (Accel+US)  │                 │             │
└─────────────┘                 └─────────────┘                 └─────────────┘
                                                                      │
                                                                      │ 3. JSON
                                                                      │ Serialization
                                                                      ▼
┌─────────────┐                 ┌─────────────┐                 ┌─────────────┐
│             │  6. Dashboard   │             │ 5. Processed    │             │
│  Grafana    │ ←───────────────│    ESP32    │ ─────────────→  │ M5StackCore2│
│ Dashboard   │    Updates      │   Gateway   │   JSON Data     │ Processing  │
│             │                 │             │                 │ & Display   │
└─────────────┘                 └─────────────┘                 └─────────────┘
                                                                      │
                                                                      │ 4. Kalman
                                                                      │ Filter &
                                                                      │ Status Display
                                                                      ▼
                                                                ┌─────────────┐
                                                                │   Bridge    │
                                                                │   Status    │
                                                                │  Display &  │
                                                                │ Boom Gate   │
                                                                │  Control    │
                                                                └─────────────┘
Message Format Structure:
{
  "node_id": "disco_board_01",
  "timestamp": "ISO8601_string",
  "message_type": "sensor_data",
  "payload": {
    "accelerometer": {
      "x": "float",
      "y": "float",
      "z": "float"
    },
    "ultrasonic": {
      "distance": "float"
    },
    "battery": "float",
    "status": "normal|warning|critical"
  },
  "checksum": "string"
}START
INITIALIZE thresholds (max_vibration, min_sag_distance)
INITIALIZE kalman_filter_vibration, kalman_filter_sag
WHILE system_active DO
RECEIVE json_data FROM ESP32
PARSE accelerometer_data, ultrasonic_data FROM json_data
IF connection_lost THEN
DISPLAY bridge_status = "UNKNOWN"
DISPLAY gate_status = "CLOSED"
ELSE
// Apply Kalman filtering for noise reduction
filtered_vibration = kalman_filter_vibration.update(accelerometer_data)
filtered_sag = kalman_filter_sag.update(ultrasonic_data)
// Calculate RMS vibration magnitude
vibration_magnitude = SQRT(filtered_vibration.x² + filtered_vibration.y² + filtered_vibration.z²)
// Apply moving average filter to smooth data
smoothed_vibration = moving_average(vibration_magnitude, window_size=10)
smoothed_sag = moving_average(filtered_sag, window_size=5)
// Weight and combine parameters
safety_score = (0.7 * normalized(smoothed_vibration)) +
(0.3 * normalized(MAX_SAG - smoothed_sag))
IF safety_score > high_threshold THEN
DISPLAY bridge_status = "DANGER"
DISPLAY gate_status = "CLOSED"
TRIGGER_ALERT on_display
ELSE IF safety_score > warning_threshold THEN
DISPLAY bridge_status = "WARNING"
DISPLAY gate_status = "RESTRICTED"
ELSE
DISPLAY bridge_status = "SAFE"
DISPLAY gate_status = "OPEN"
END IF
END IF
UPDATE_DISPLAY WITH bridge_status, gate_status, sensor_readings
SEND_STATUS_UPDATE TO ESP32 for dashboard
WAIT sampling_interval
END WHILE
END
START
  CLASS KalmanFilter:
    INITIALIZE state_estimate, error_covariance
    INITIALIZE process_noise, measurement_noise

    FUNCTION predict():
      // Prediction step
      predicted_state = state_transition * state_estimate
      predicted_covariance = state_transition * error_covariance * transpose(state_transition) + process_noise
      RETURN predicted_state, predicted_covariance

    FUNCTION update(measurement):
      predicted_state, predicted_covariance = predict()

      // Update step
      kalman_gain = predicted_covariance * transpose(observation_model) *
                    inverse(observation_model * predicted_covariance * transpose(observation_model) + measurement_noise)

      state_estimate = predicted_state + kalman_gain * (measurement - observation_model * predicted_state)
      error_covariance = (identity_matrix - kalman_gain * observation_model) * predicted_covariance

      RETURN state_estimate
  END CLASS

  // Initialize filters for different sensors
  vibration_filter = KalmanFilter(process_noise=0.1, measurement_noise=0.5)
  sag_filter = KalmanFilter(process_noise=0.05, measurement_noise=0.3)

  WHILE system_active DO
    RECEIVE sensor_data FROM ESP32

    filtered_vibration = vibration_filter.update(sensor_data.accelerometer)
    filtered_sag = sag_filter.update(sensor_data.ultrasonic)

    SEND filtered_data TO safety_evaluation_algorithm

    WAIT filter_interval
  END WHILE
END
START
  INITIALIZE ble_connection, wifi_connection

  WHILE system_active DO
    RECEIVE raw_sensor_data FROM disco_board VIA BLE

    // Create JSON structure
    json_packet = {
      "node_id": disco_board.id,
      "timestamp": get_current_timestamp(),
      "message_type": "sensor_data",
      "payload": {
        "accelerometer": {
          "x": raw_sensor_data.accel_x,
          "y": raw_sensor_data.accel_y,
          "z": raw_sensor_data.accel_z
        },
        "ultrasonic": {
          "distance": raw_sensor_data.ultrasonic_distance
        },
        "battery": raw_sensor_data.battery_level,
        "status": raw_sensor_data.node_status
      },
      "checksum": calculate_checksum(raw_sensor_data)
    }

    // Serialize to JSON string
    json_string = serialize_to_json(json_packet)

    // Forward to M5StackCore2
    SEND json_string TO m5stack_core2

    // Store for dashboard
    STORE json_packet IN local_buffer
    UPDATE dashboard_data WITH json_packet

    WAIT serialization_interval
  END WHILE
END
The Grafana dashboard serves as the primary visual interface for the bridge monitoring system, providing real-time data visualization and historical analysis capabilities through the ESP32 gateway. The dashboard is designed to be intuitive, informative, and actionable for operators monitoring bridge conditions.
The dashboard consists of the following panels and visualizations:
-
Bridge Status Overview
- Real-time status indicator (Safe/Warning/Danger)
- Current boom gate position display
- System connectivity status
- M5StackCore2 processing status
-
Vibration Monitoring
- Real-time vibration magnitude graphs (X, Y, Z axes)
- Kalman-filtered vibration trends
- Historical vibration patterns
- Frequency analysis charts
-
Sag Distance Monitoring
- Current bridge-to-ground/water distance
- Filtered sag measurements from M5StackCore2
- Critical threshold indicators
- Water level correlation charts
-
System Health
- DISCO board battery levels and connectivity
- ESP32 gateway performance metrics
- M5StackCore2 processing load and status
- BLE communication quality metrics
-
Alert History
- Recent alerts and warnings from M5StackCore2
- Alert frequency analysis
- Response time tracking
- System downtime logs
-
Data Analytics
- Statistical analysis of filtered sensor data
- Predictive maintenance indicators
- Correlation analysis between vibration and sag
- Long-term trend analysis
- InfluxDB: Time-series database storing all processed sensor readings from ESP32
- ESP32 Gateway: Direct Wi-Fi connection for real-time data streaming and JSON data handling
- Alert Manager: Integration with Grafana's alert management system
- MySQL Database: Historical data storage for long-term analysis of processed data
- Responsibilities:
- Setup and program the DISCO board for sensor data collection
- Interface accelerometer and HC-SR04 ultrasonic sensor with DISCO board
- Develop firmware for integrated sensor readings
- Implement BLE transmission protocols on DISCO board
- Calibrate sensors and optimize power consumption
- Create sensor mounting solutions for bridge installation
- Develop sensor data pre-processing algorithms on DISCO board
- Justification:
"My focus will be on ensuring the reliable collection of raw sensor data from the bridge using the DISCO board platform. I will concentrate on the intricacies of sensor integration, firmware development for the DISCO board, and optimizing the BLE data transmission to the ESP32. This foundational work is critical for providing high-quality raw data for the entire system, and I'll implement efficient data packaging techniques to minimize transmission overhead while maximizing data integrity."
- Responsibilities:
- Program M5StackCore2 for data processing and display
- Implement Kalman filtering algorithms on M5StackCore2
- Develop bridge safety evaluation algorithms
- Create status display interface on M5StackCore2 screen
- Program ESP32 for BLE reception and JSON serialization
- Establish communication bridge between ESP32 and M5StackCore2
- Implement error handling and system recovery procedures
- Justification:
"I will take the lead on the core processing and communication hub of our system. My efforts will be directed towards implementing advanced Kalman filtering on the M5StackCore2, creating reliable JSON serialization on the ESP32, and ensuring the M5Stack display provides clear, real-time status information. My implementation will include comprehensive data validation and filtering capabilities that form the intelligent decision-making core of the bridge monitoring system."
- Responsibilities:
- Design and implement Grafana dashboard through ESP32 gateway
- Create data visualization components for processed sensor data
- Establish Wi-Fi connectivity and web server functionality on ESP32
- Implement alert notification system integration
- Develop user authentication and access control for dashboard
- Create comprehensive system documentation and user guides
- Conduct end-to-end system integration testing
- Justification:
"My primary contribution will be to ensure seamless visualization and monitoring of the processed bridge data. I will focus on creating an intuitive, real-time Grafana dashboard that leverages the ESP32's gateway capabilities, presenting the filtered and processed data from the M5StackCore2 in an accessible format. I'll also ensure robust system integration between all components, making the complex sensor-processing-display pipeline transparent and actionable for end users."
| Task ID | Task Name | Assignee | Week 1 (D1–D7) | Week 2 (D8–D14) | Dependencies |
|---|---|---|---|---|---|
| T1.1 | Hardware Acquisition & Setup | All | ████████ | - | |
| T1.2 | DISCO Board Sensor Integration Setup | Member 1 | █████████ | T1.1 | |
| T1.3 | M5StackCore2 Development Environment Setup | Member 2 | ██████ | T1.1 | |
| T1.4 | ESP32 Gateway Configuration | Member 2 | ██████ | T1.1 | |
| T1.5 | BLE Communication Protocol Implementation | Member 1 | ████████ | T1.2 | |
| T1.6 | Grafana Server Setup & ESP32 Integration | Member 3 | ██████ | T1.1 | |
| T2.1 | DISCO Board Firmware Development | Member 1 | ██████ | ██ | T1.2, T1.5 |
| T2.2 | ESP32 JSON Serialization Implementation | Member 2 | ██████ | ██ | T1.4, T1.5 |
| T2.3 | M5StackCore2 Kalman Filter Implementation | Member 2 | ████ | ████ | T1.3 |
| T2.4 | Bridge Safety Algorithm Development | Member 2 | ████ | ██████ | T2.3 |
| T2.5 | M5StackCore2 Display Interface Development | Member 2 | ██ | ██████ | T2.4 |
| T2.6 | Dashboard Layout & Data Visualization | Member 3 | ████ | ██████ | T1.6 |
| T2.7 | Alert System Integration | Member 3 | ██ | ████ | T2.6 |
| T3.1 | BLE to ESP32 Communication Testing | Member 1,2 | ████████ | T2.1, T2.2 | |
| T3.2 | DISCO Board Sensor Accuracy Validation | Member 1 | ██████ | T2.1 | |
| T3.3 | Kalman Filter Performance Testing | Member 2 | ██████ | T2.3 | |
| T3.4 | M5StackCore2 Display Response Testing | Member 2 | ██████ | T2.5 | |
| T3.5 | ESP32 Gateway Dashboard Integration | Member 3 | ████████ | T2.6, T2.2 | |
| T3.6 | End-to-End System Integration Testing | All | ████ | T3.1, T3.5 | |
| T3.7 | System Stability & Performance Testing | All | ████████ | T3.6 | |
| T3.8 | Performance Optimization | All | ██████ | T3.7 | |
| T4.1 | Wiki Documentation Finalization | All | ██████ | - | |
| T4.2 | Demo & Presentation Preparation | All | ████████ | T3.7, T3.8 | |
| T4.3 | User Guide Creation | Member 3 | ████ | T4.1 | |
| T4.4 | Final Integration Testing | All | ████ | T3.8 |
Legend: █ = Task in progress
| Component | Model | Key Specifications | Purpose |
|---|---|---|---|
| Sensor Collection Node | STM32 DISCO Board | STM32F4 MCU, BLE capability, GPIO pins | Sensor data collection and BLE transmission |
| Processing & Display Unit | M5StackCore2 | ESP32-D0WDQ6, 2.0" IPS LCD, 16MB Flash | Kalman filtering, safety evaluation, status display |
| Gateway Node | ESP32-C3 DevKit | 160MHz RISC-V CPU, Wi-Fi, BLE 5.0 | JSON serialization, dashboard gateway |
| Accelerometer | Integrated/External | ±2/±4/±8/±16 g range, 1.6Hz-6.6kHz bandwidth | Vibration measurement |
| Ultrasonic Sensor | HC-SR04 | 2-400cm range, 15° measurement angle | Sag distance measurement |
| Component | Technology | Version | Purpose |
|---|---|---|---|
| Firmware (DISCO) | STM32CubeIDE | Latest | Sensor interfacing and BLE transmission |
| Firmware (M5Stack) | Arduino IDE/PlatformIO | Latest | Kalman filtering and display control |
| Firmware (ESP32) | ESP-IDF/Arduino | 4.4.0+ | JSON serialization and Wi-Fi gateway |
| Communication | BLE using GATT | 5.0 | Data transmission protocol |
| Database | InfluxDB | 2.6.0+ | Time-series data storage |
| Visualization | Grafana | 9.3.2+ | Dashboard and analytics |
| Data Processing | C++/Arduino Libraries | Latest | Real-time filtering and processing |