A lightweight, real-time web dashboard for monitoring Slurm HPC cluster jobs. View logs, track resource usage, analyze job patterns, and manage your workloads from a clean, modern interface.
pip install slurm-dashboard- Real-time job monitoring - Live log streaming with auto-refresh
- Multiple views - Table, Timeline, Pipeline DAG, Heatmap, and Insights
- Job management - Submit, cancel, and resubmit jobs with templates
- Smart log analysis - Automatic error detection and highlighting
- Resource tracking - CPU/GPU hours, memory efficiency, partition health
- Analytics dashboard - Job patterns, peak hours, failure analysis
- Batch operations - Select multiple jobs for cancel/resubmit/export
- Dark mode - Easy on the eyes during those late-night debugging sessions
|
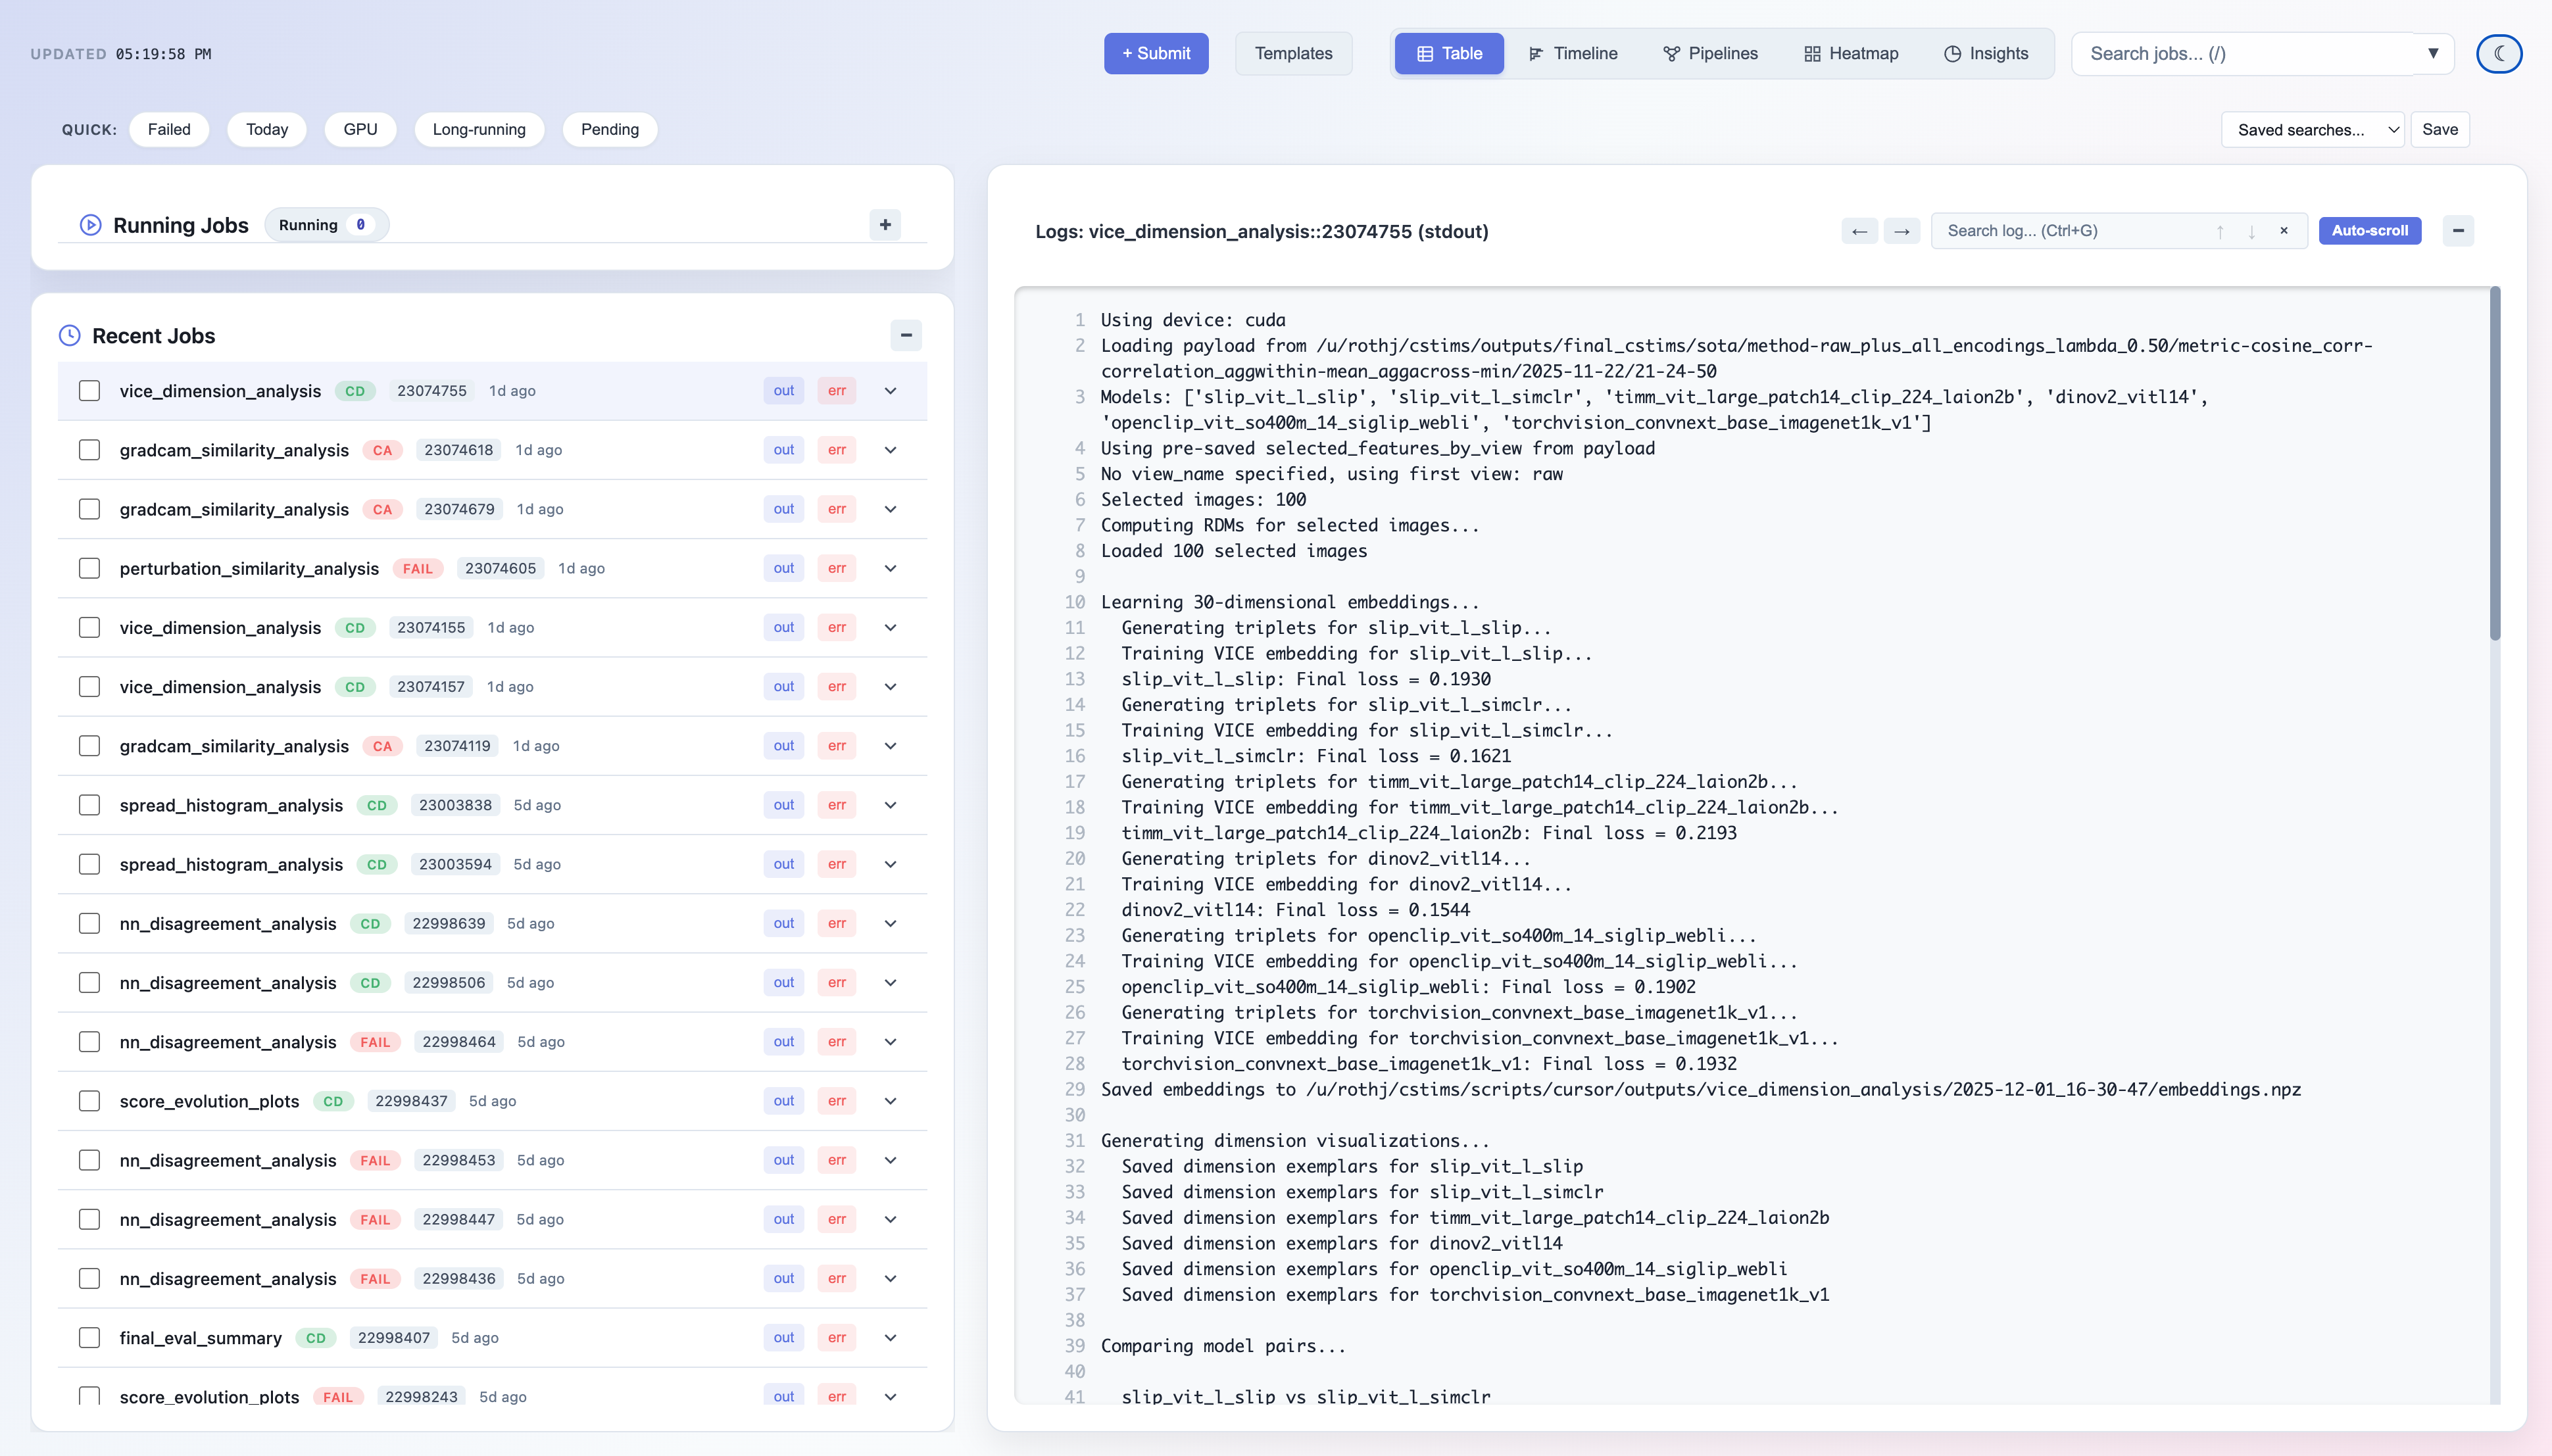
Job List & Logs 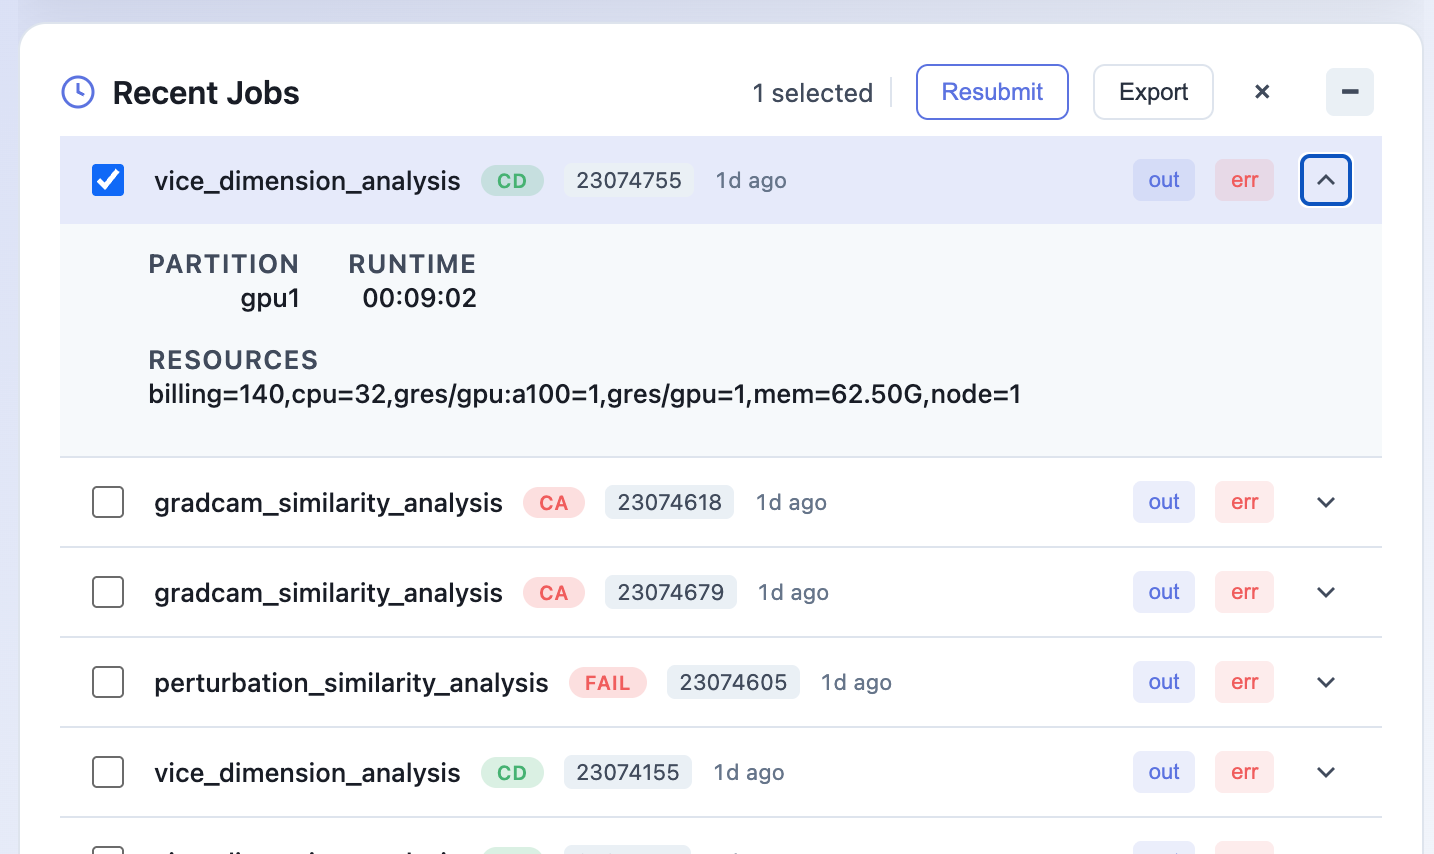
|
Insights Dashboard 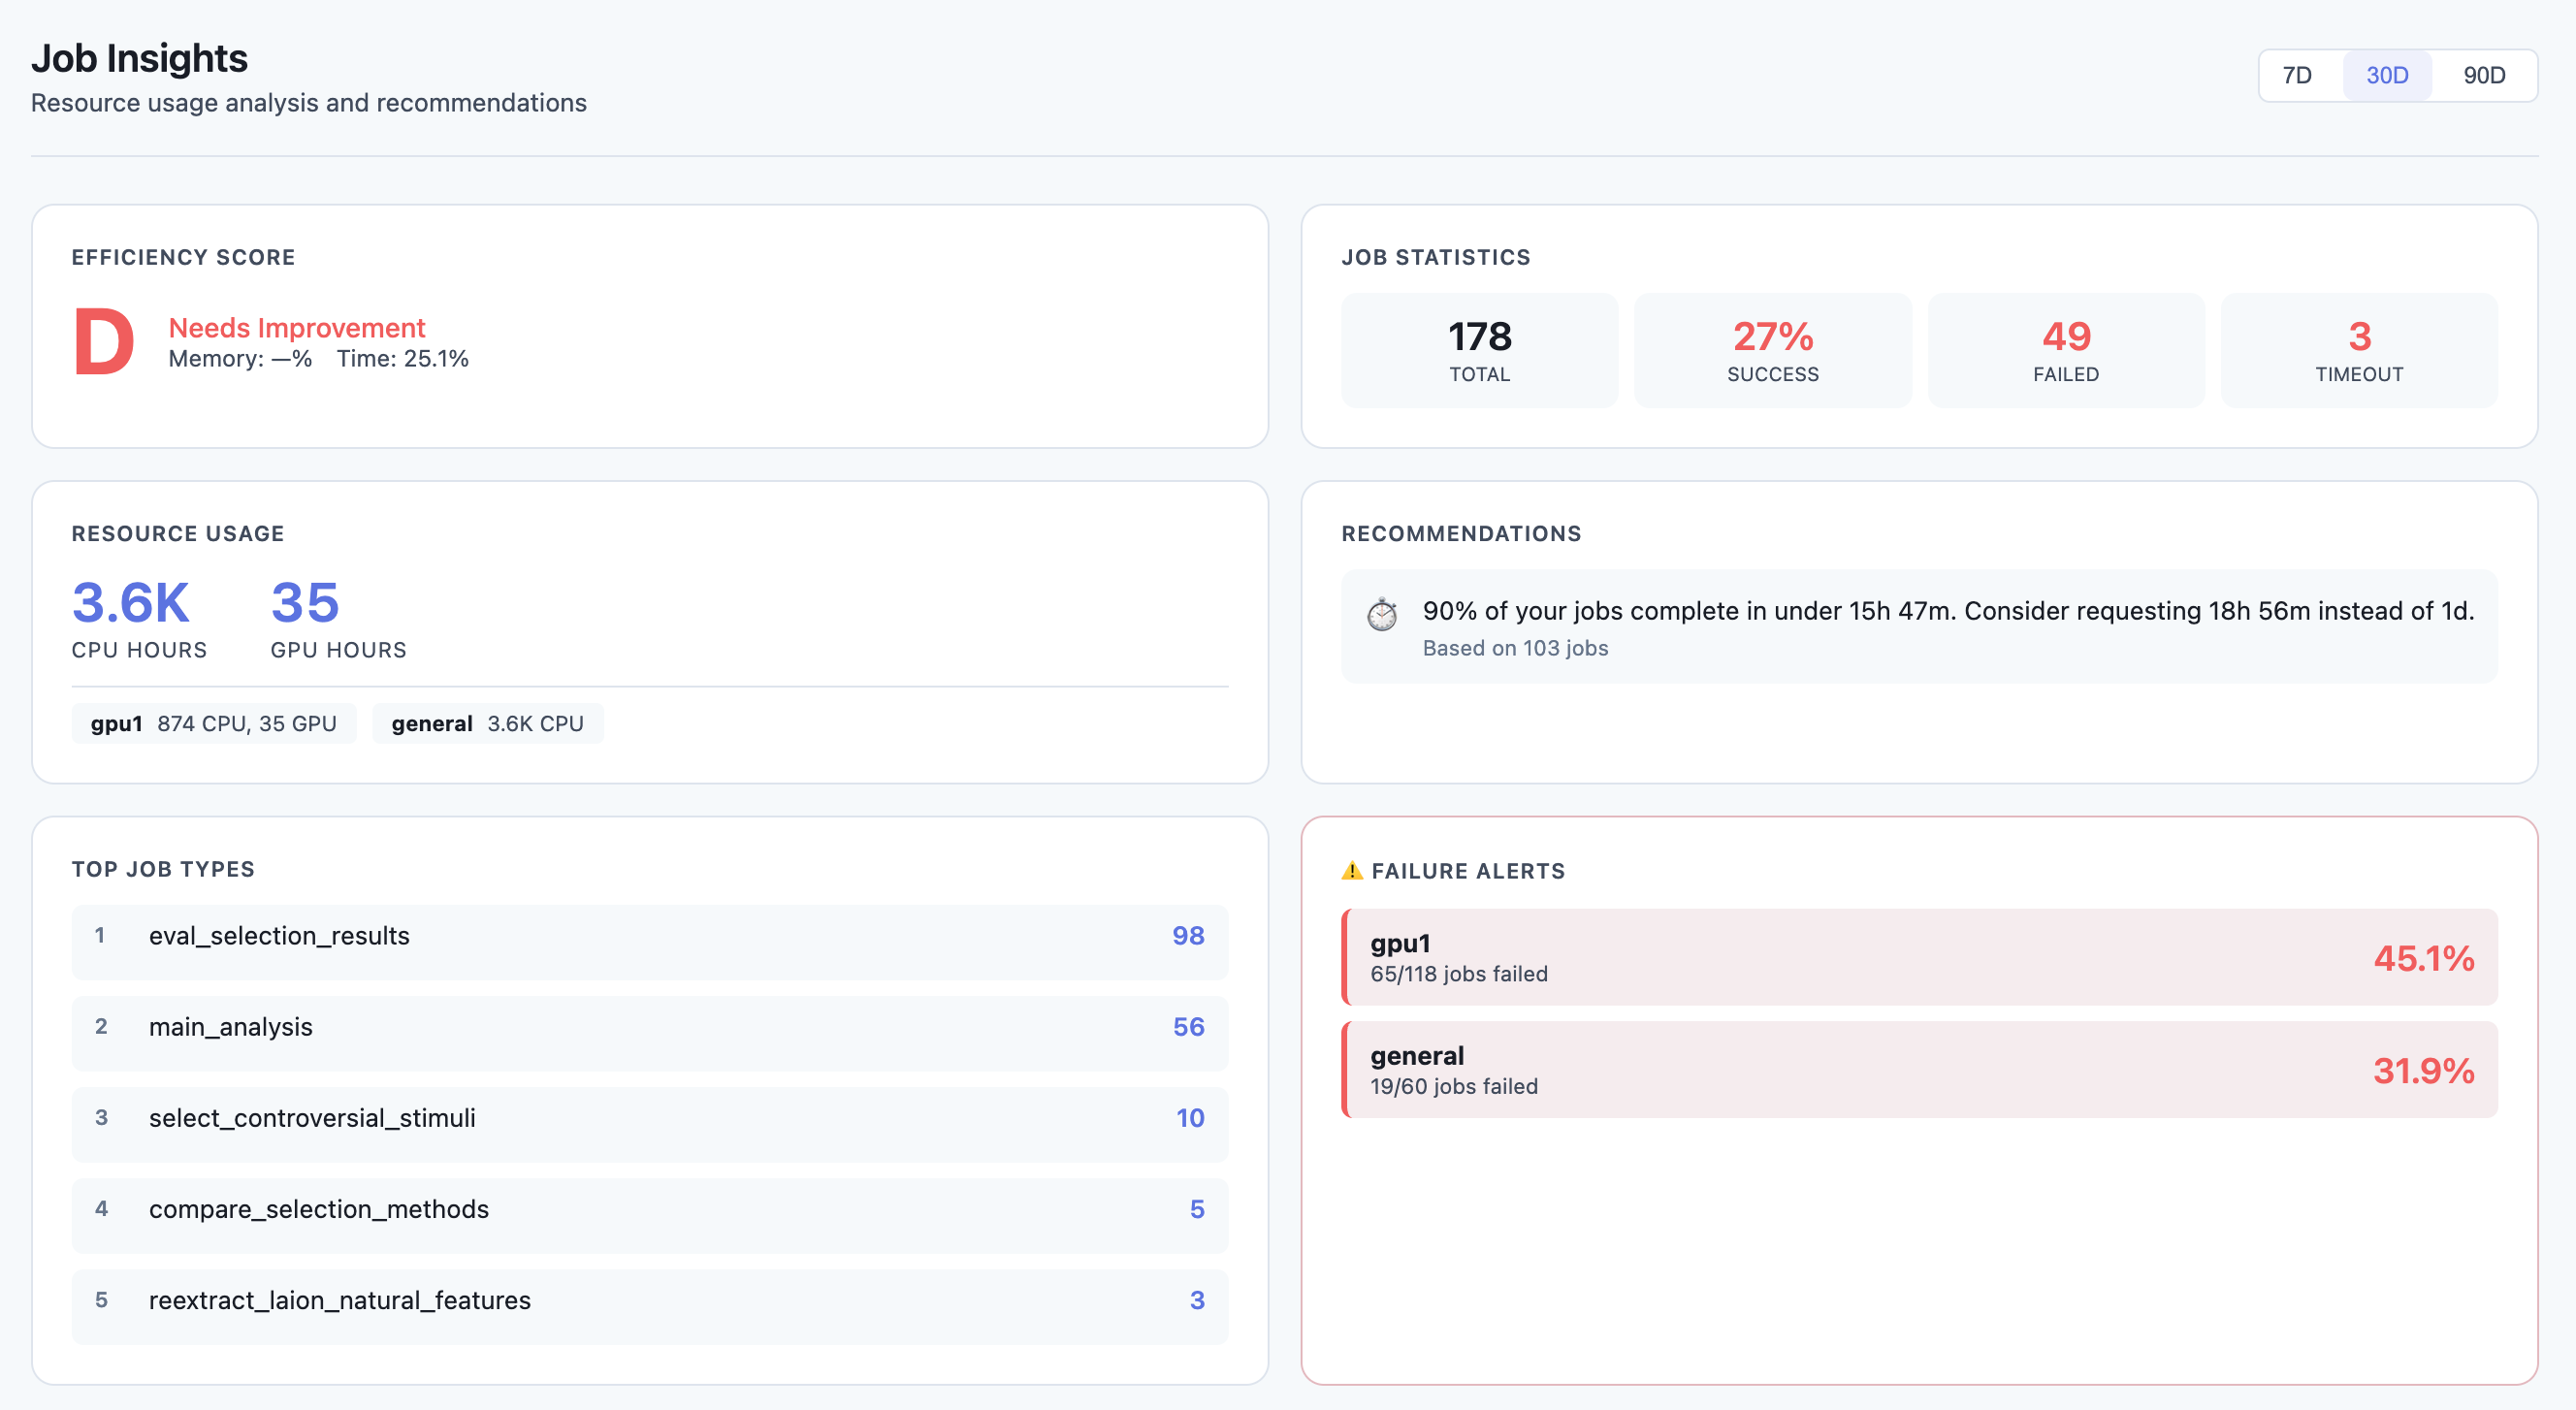
|
|
Heatmap View 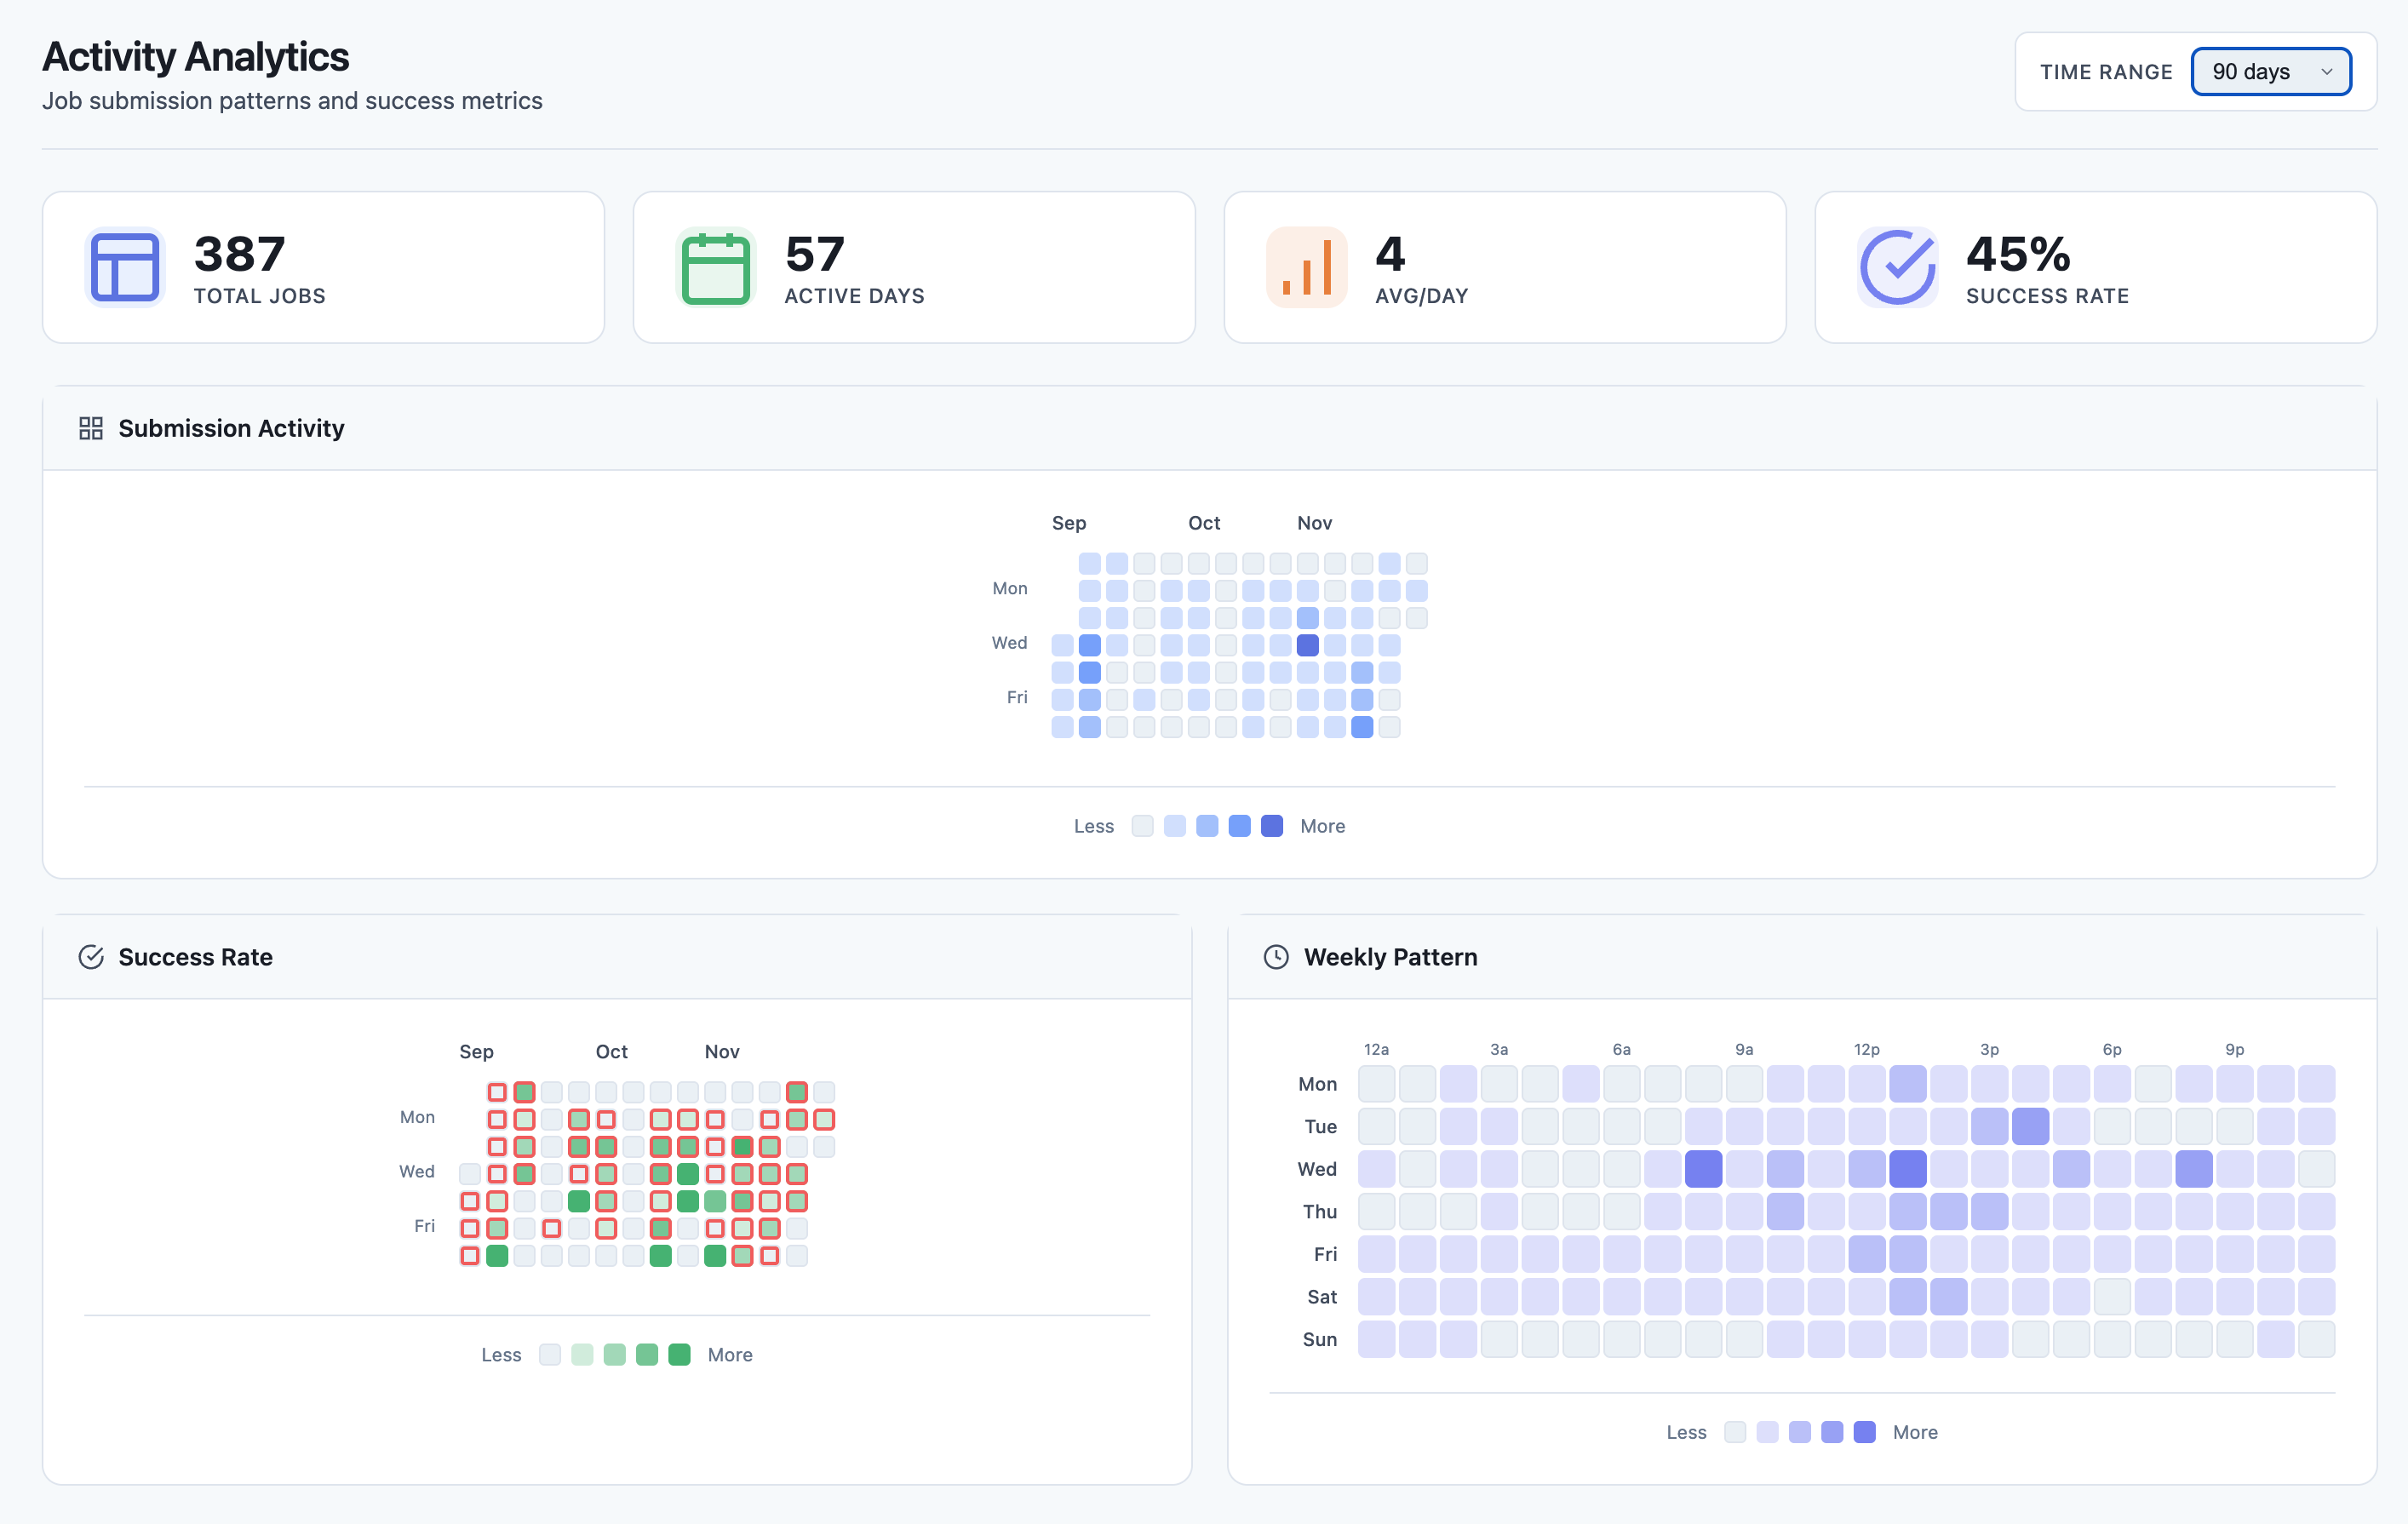
|
# Basic usage - uses current user and default log location
slurm-dashboard

# Specify log directory
slurm-dashboard --log-root /path/to/your/logs

# Full options
slurm-dashboard --log-root ~/slurm-logs --user myusername --port 8080
Then open http://localhost:5000 in your browser.
| Option | Default | Description |
|---|---|---|
--host |
127.0.0.1 |
Host to bind to |
--port |
5000 |
Port to bind to |
--log-root |
~/slurm-logs |
Root directory for Slurm log files |
--log-pattern |
{name}/job.{stream}.{id} |
Log file path pattern |
--user |
Current user | Slurm username to filter jobs |
--refresh-cache |
20 |
Cache refresh interval in seconds |
The dashboard needs to know where your job logs are stored and how they're named. Use --log-pattern to match your cluster's configuration.
Pattern variables:
{name}- Job name (from--job-nameor script name){id}- Slurm job ID{stream}-outfor stdout,errfor stderr
Default Slurm (flat directory):
# Logs like: /home/user/slurm-12345.out, slurm-12345.err
slurm-dashboard --log-root ~ --log-pattern "slurm-{id}.{stream}"
Subdirectory per job name (default):
# Logs like: ~/slurm-logs/train_model/job.out.12345
slurm-dashboard --log-root ~/slurm-logs --log-pattern "{name}/job.{stream}.{id}"
Nested by job ID:
# Logs like: ~/logs/experiment/12345/stdout, ~/logs/experiment/12345/stderr
slurm-dashboard --log-root ~/logs --log-pattern "{name}/{id}/std{stream}"
Project-based structure:
# Logs like: /scratch/myproject/logs/job_12345.out
slurm-dashboard --log-root /scratch/myproject/logs --log-pattern "job_{id}.{stream}"
Date-based directories (use wildcards in log-root):
# For logs like: ~/logs/2024-01/train_12345.out
# Run from within the date directory or use a symlink
slurm-dashboard --log-root ~/logs/2024-01 --log-pattern "{name}_{id}.{stream}"To work with the dashboard, configure your Slurm scripts to write logs to a consistent location:
#!/bin/bash
#SBATCH --job-name=train_model
#SBATCH --output=/home/%u/slurm-logs/%x/job.out.%j
#SBATCH --error=/home/%u/slurm-logs/%x/job.err.%j

# Your job commands here
python train.py
Slurm filename variables:
%u- Username%x- Job name%j- Job ID%A- Array job ID%a- Array task ID
For array jobs, you might want to include the array task ID:
#SBATCH --output=/home/%u/slurm-logs/%x/job.out.%A_%a
#SBATCH --error=/home/%u/slurm-logs/%x/job.err.%A_%a
Then use:
slurm-dashboard --log-pattern "{name}/job.{stream}.{id}"
# The dashboard handles array job IDs like 12345_0, 12345_1 automaticallyIf you're running the dashboard on a login node:
# On the cluster
slurm-dashboard --port 5000

# On your local machine (in another terminal)
ssh -L 5000:localhost:5000 user@cluster.example.com

# Then open http://localhost:5000 in your browserTo access from other machines on the same network (less secure):
slurm-dashboard --host 0.0.0.0 --port 5000Note: Only do this on trusted networks. The dashboard can cancel and submit jobs.
# Using nohup
nohup slurm-dashboard --log-root ~/slurm-logs > dashboard.log 2>&1 &

# Using screen
screen -S dashboard
slurm-dashboard --log-root ~/slurm-logs
# Ctrl+A, D to detach

# Using tmux
tmux new -s dashboard
slurm-dashboard --log-root ~/slurm-logs
# Ctrl+B, D to detach- Running jobs with real-time status
- Recent jobs with expandable details
- Click any job to view its logs
- Quick filters for state, partition, GPU usage
- Gantt-style visualization of job history
- See job overlaps and gaps
- Filter by state or job name
- Zoom in/out for different time scales
- DAG visualization of job dependencies
- Track pipeline progress
- See which jobs are blocking others
- GitHub-style activity calendar
- Hourly submission patterns
- Success/failure rate visualization
- Efficiency score (A-F grade)
- Resource usage metrics (CPU/GPU hours)
- Memory and time limit recommendations
- Failure pattern detection
- Peak hours analysis
- Top job types
- Check that
--log-rootpoints to the correct directory - Verify
--log-patternmatches your log file naming - Ensure log files exist and are readable
- The dashboard requires Slurm commands to be in your PATH
- Make sure you're running on a node with Slurm client tools installed
- Check that
--usermatches the username used when submitting jobs - Verify jobs are in sacct history:
sacct -u $USER --starttime=now-7days
- Ensure the log files are accessible from the node running the dashboard
- Check file permissions on the log directory
# Install in development mode
pip install -e ".[dev]"

# Run with debug mode
FLASK_DEBUG=1 slurm-dashboard

# Run tests
pytestMIT