![]()


Draws a Ramachandran plot based on the input PDB file (e.g. 1mbn.pdb). Makes use of a Gaussian KDE (kernel density
estimation) to plot the density of favoured torsion angles (φ and ψ).
| Single mode | Batch mode |
|---|---|
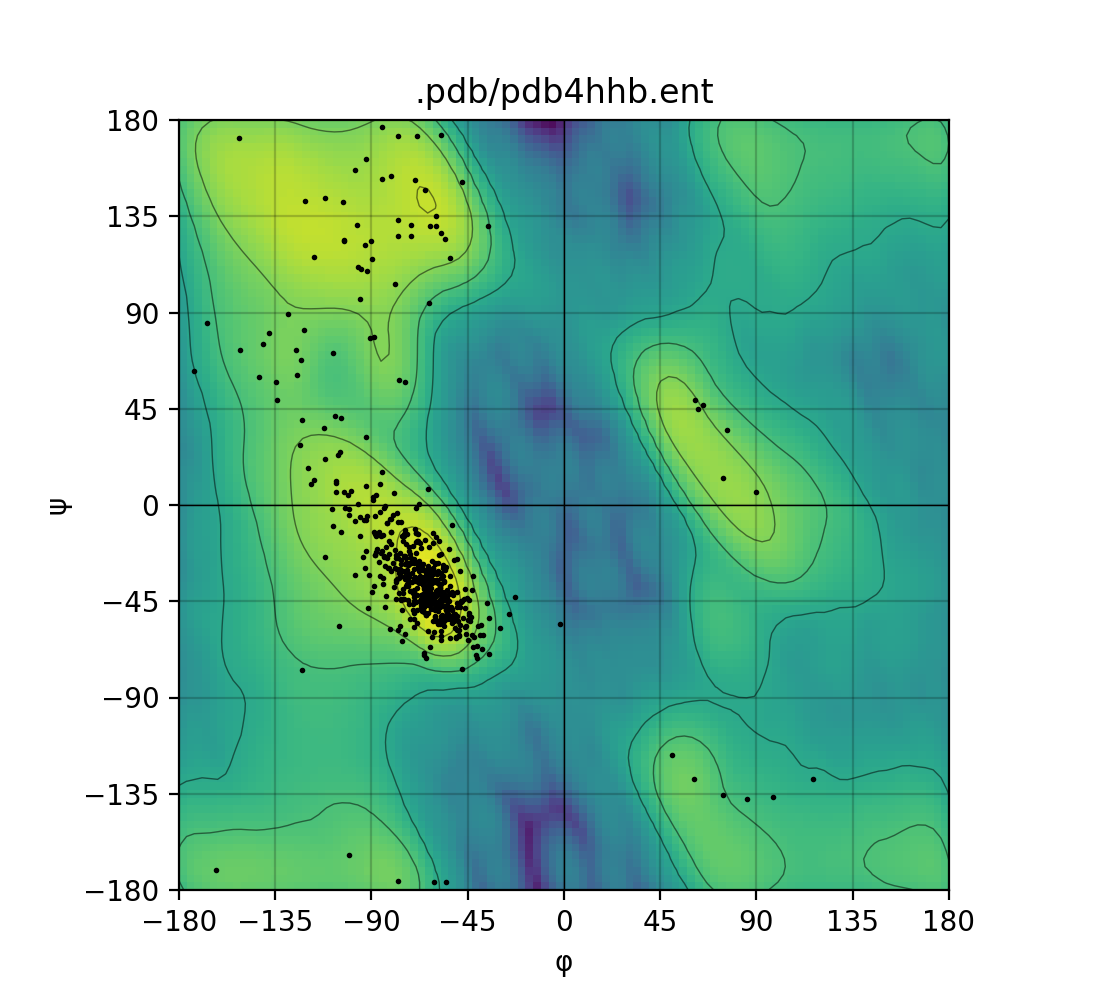 |
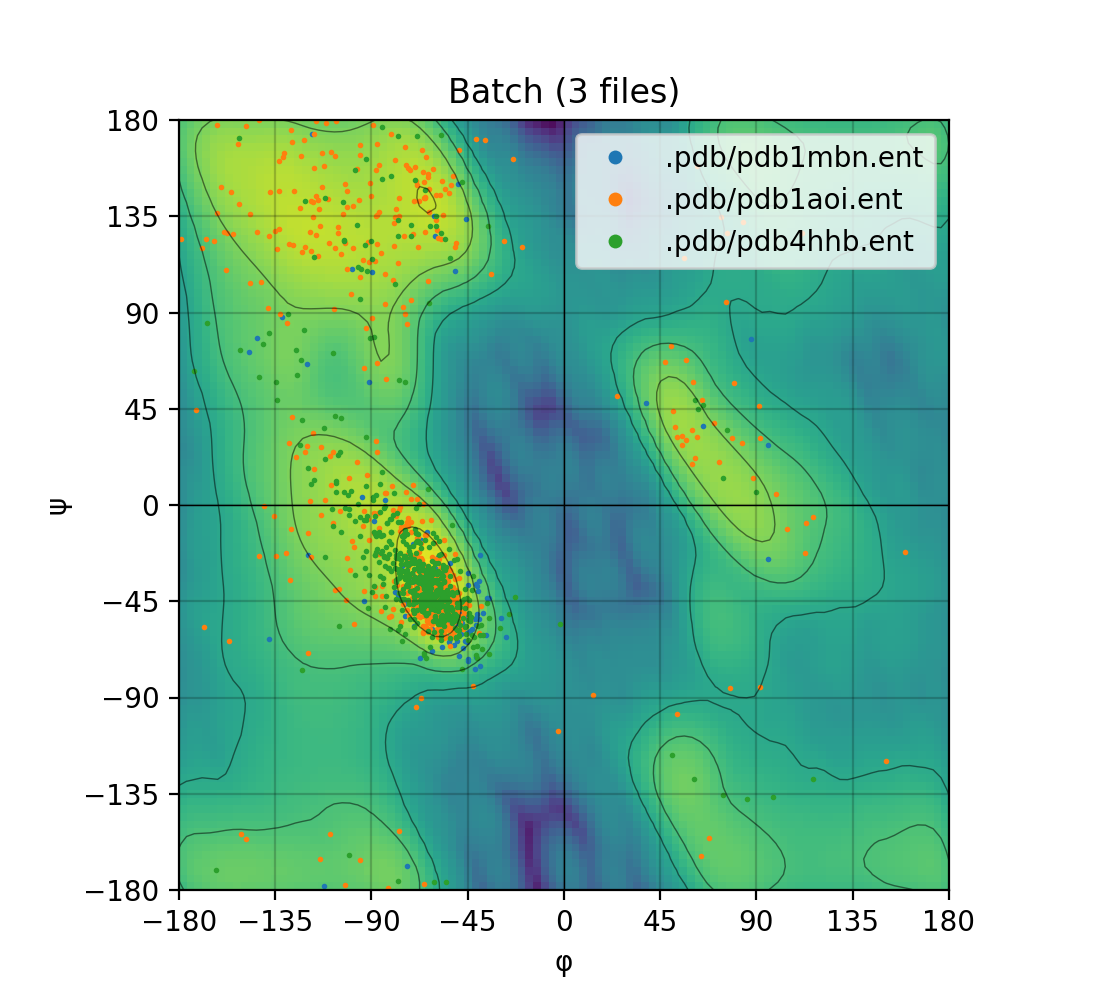 |
RamachanDraw is hosted on PyPi.
pip install ramachandrawRamachanDraw includes useful functions to effortlessly draw a Ramachandran plot.
To draw a Ramachandran plot, we need a PDB file. RamachanDraw conveniently includes a function to automatically fetch and locally store the PDB file for the given PDB id.
from ramachandraw.utils import fetch_pdb

fetch_pdb(pdb_id, verbose)
pdb_id (str|list|tuple): PDB id(s) corresponding to the PDB file(s) to be downloadedverbose (bool)(optional): set the verbosity, defaults toFalse- Returns: path(s) to PDB file(s)
RamachanDraw extracts the φ and ψ torsion angles from the PDB file by taking advantage of the Biopython module. Additionally, aminoacid residues that were not drawn on the plot can be extract using the return_ignored argument.
from ramachandraw.parser import get_phi_psi

phi_psi(pdb_filepath, prune, hide_warnings)
pdb_id (str|list|tuple): PDB filepath(s)prune (bool)(optional): prunes aminoacids with missing torsion angle(s), defaults toTruehide_warnings (bool)(optional): sets the verbosity of the PDB structure parser, defaults toTrue- Returns: Dictionary with keys as aminoacid residues and values as (φ, ψ) angles.
Makes use of the matplotlib module to draw a highly customizable Ramachandran plot.
from ramachandraw.utils import plot

plot(pdb_filepath, cmap="viridis", alpha=0.75, dpi=100, save=True, show=False, filename="plot.png")
pdb_file (str|list|tuple): PDB id(s) corresponding to the PDB entry to be downloadedcmap (str)(optional): colormap to be used (frommatplotlib) for the density of the favoured ("allowed") regions; default is viridis.alpha (float)(optional): sets the opacity of the colormap (value between 0-1); default is 0.75.dpi (int)(optional): resolution (in dots per inch); default is100.save (bool)(optional):True: saves the plot locally; default is True.
show (bool)(optional):True: shows the plot using the Qt5Agg backend; default is False.
filename (str)(optional): filename to be used in case the plot is saved (i.e.save=True); default isplot.png.- Returns: Ramachandran plot (
matplotlib.axes.Axesobject) that can be further customized if needed
Herein you will find an example from the PDB id corresponding to the myoglobin entry: 1MBN - in the Protein Data Bank.
from ramachandraw.parser import get_phi_psi
from ramachandraw.utils import fetch_pdb, plot


# PDB id
pdb_id = "1mbn"

# Draw the Ramachandran plot
plot(fetch_pdb(pdb_id))

# Generate a dictionary to store the (phi, psi) torsion angles
torsion_angles = get_phi_psi(fetch_pdb(pdb_id))from ramachandraw.parser import get_phi_psi
from ramachandraw.utils import fetch_pdb, plot
# PDB id
pdb_ids = ["1mbn", "4hhb"]
# Draw the Ramachandran plot
plot(fetch_pdb(pdb_ids))
# Generate a list of dictionaries to store the (phi, psi) torsion angles
torsion_angles = get_phi_psi(fetch_pdb(pdb_ids))Feedback and constructive criticism is welcome. If necessary, open an issue in the issues tab.