![]()
Excelify is a DataFrame-like library that lets users create Excel spreadsheets.
Click here for documentations.
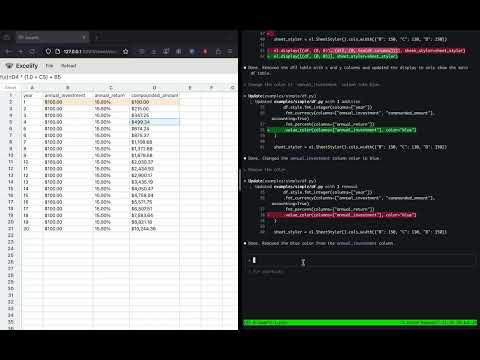
(Click the image above to go to a demo video.)
pip install excelify-libWe'll create a table that demonstrates compounded interest.
We first define an "emtpy table" using el.ExcelFrame:
import excelify as el
df = el.ExcelFrame.empty(
    columns=["year", "boy_amount", "annual_return", "eoy_amount"],
    height=3,
)
Printing df will show the following:
>>> df
shape: (3, 4)
+---+----------+----------------+-------------------+----------------+
|   | year (A) | boy_amount (B) | annual_return (C) | eoy_amount (D) |
+---+----------+----------------+-------------------+----------------+
| 1 |          |                |                   |                |
| 2 |          |                |                   |                |
| 3 |          |                |                   |                |
+---+----------+----------------+-------------------+----------------+
The letters A, B, C, D,... in each column after the column name represents the column index, similar to Excel.
Excelify has a Polars-like API that lets you define the formula for all the
cells in a given column. For example, we can define static integer value
representing the number of years elapsed using el.lit():
df = df.with_columns(
   el.lit([i for i in range(3)]).alias("year"),
)
However, unlike DataFrame, you can define a formula that'll be evaluated lazily, just like Excel spreadsheets.
For example, suppose you'd like to define annual return to be 10% every year.
You can either use above el.lit function, or you can define a static value on
the first row cell and make subsequent rows refer to the previous row's value
using el.map and el.col().prev(1):
def annual_return_formula(idx: int):
    if idx == 0:
        return 0.10
    else:
        return el.col("annual_return").prev(1)

df = df.with_columns(
    el.map(annual_return_formula).alias("annual_return")
)
This way, you can edit only the first row cell of annual_return to change the
annual return value for all the years.
Similarly, you can define the amount of money in the beginning and end of the year as follows:
df = df.with_columns(
    el.map(
        # You can also use lambda expression to make it more concise.
        lambda idx: 100.0
        if idx == 0
        else el.col("eoy_amount").prev(1)
    ).alias("boy_amount"),
    (el.col("boy_amount") * (1.0 + el.col("annual_return"))).alias("eoy_amount"),
)
If you print df, you'll get the following:
>>> print(df)
shape: (3, 4)
+---+----------+----------------+-------------------+-------------------+
|   | year (A) | boy_amount (B) | annual_return (C) |  eoy_amount (D)   |
+---+----------+----------------+-------------------+-------------------+
| 1 |   0.00   |     100.00     |       0.10        | (B1 * (1.0 + C1)) |
| 2 |   1.00   |       D1       |        C1         | (B2 * (1.0 + C2)) |
| 3 |   2.00   |       D2       |        C2         | (B3 * (1.0 + C3)) |
+---+----------+----------------+-------------------+-------------------+
Unlike DataFrame, ExcelFrame stores the formula of the cell by default. To see
numerical values, you can call df.evaluate() - it'll return a new ExcelFrame
where each cell will store the computed value of the formula in df:
>>> print(df.evaluate())
shape: (3, 4)
+---+----------+----------------+-------------------+----------------+
|   | year (A) | boy_amount (B) | annual_return (C) | eoy_amount (D) |
+---+----------+----------------+-------------------+----------------+
| 1 |   0.00   |     100.00     |       0.10        |     110.00     |
| 2 |   1.00   |     110.00     |       0.10        |     121.00     |
| 3 |   2.00   |     121.00     |       0.10        |     133.10     |
+---+----------+----------------+-------------------+----------------+
To export the ExcelFrame to excel, simply call df.to_excel().
To run excelify-viewer locally, you can run
excelify-viewer --file-path $FILE_NAMEwhere FILE_NAME points to the python script that constructs the table.
The script must end with excelify.display. See files in examples/ directory
to see sample scripts.