Here is an example of the power of BigQuery and SQL for feature engineering.
This will give you a record of weather data, for every day, for every location in your dataset.
It can be used as input into further analysis or data products. For the example here I have a table with all 50 US state capitals and lat/lon. You can use this SQL with any location dataset you have that includes lat/lon values.
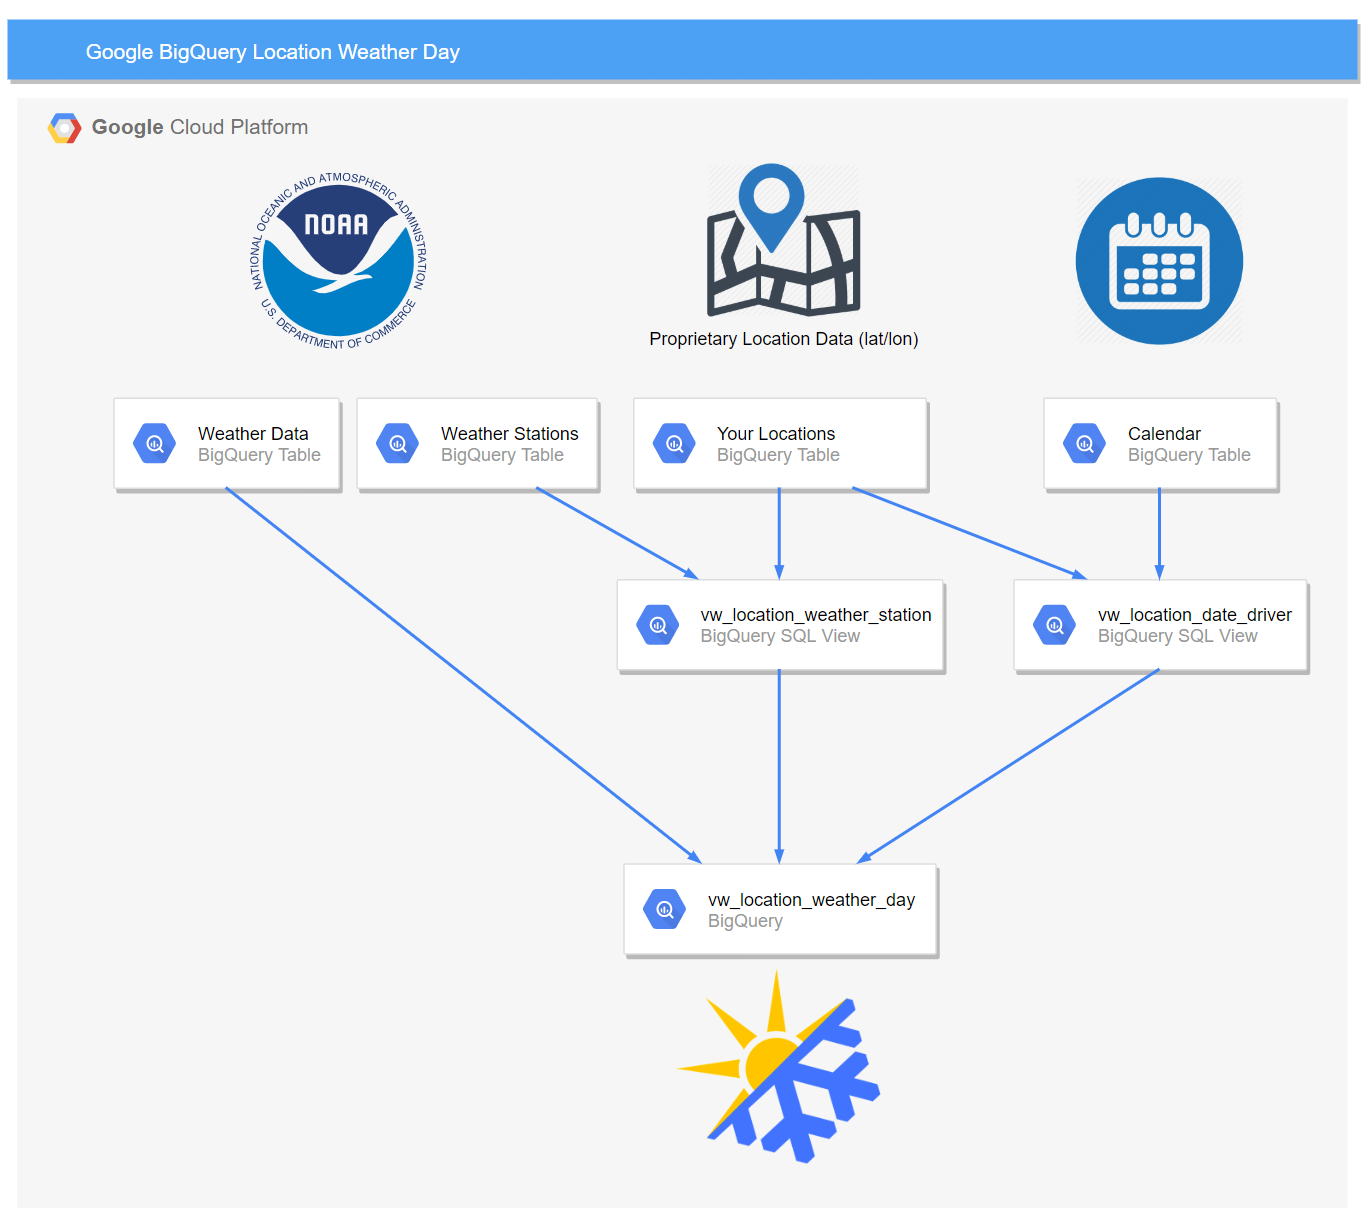
Cross join calendar and location together to force a row for every day for every location. We also cross join every location with every weather station in the lower 48 states. Using the power of BigQuery we are able to EXPLODE the row count and calculations without worrying about spool space limitations and query time.
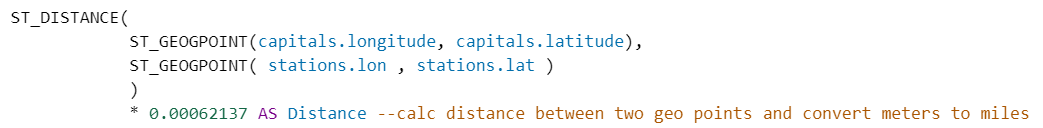
We can calc the distance between each of your location and every weather station using BigQuery geo functions. I have been truly impressed with the performance of these built in SQL functions.
Joining to the xref table 3x and COALESCE-ing the output to the first not null value for every attribute, we can be sure that any time a weather station is down, we still get data from the next closest station.
We are pulling data from the year 2000 until current year with the * in here: `bigquery-public-data.noaa_gsod.gsod20*` this pulls 2000, 2001, and so on all the way through 2019.
With all of this data engineering done in SQL and wrapped into a BigQuery view, we have enabled weather based analytics for data science and analytics.
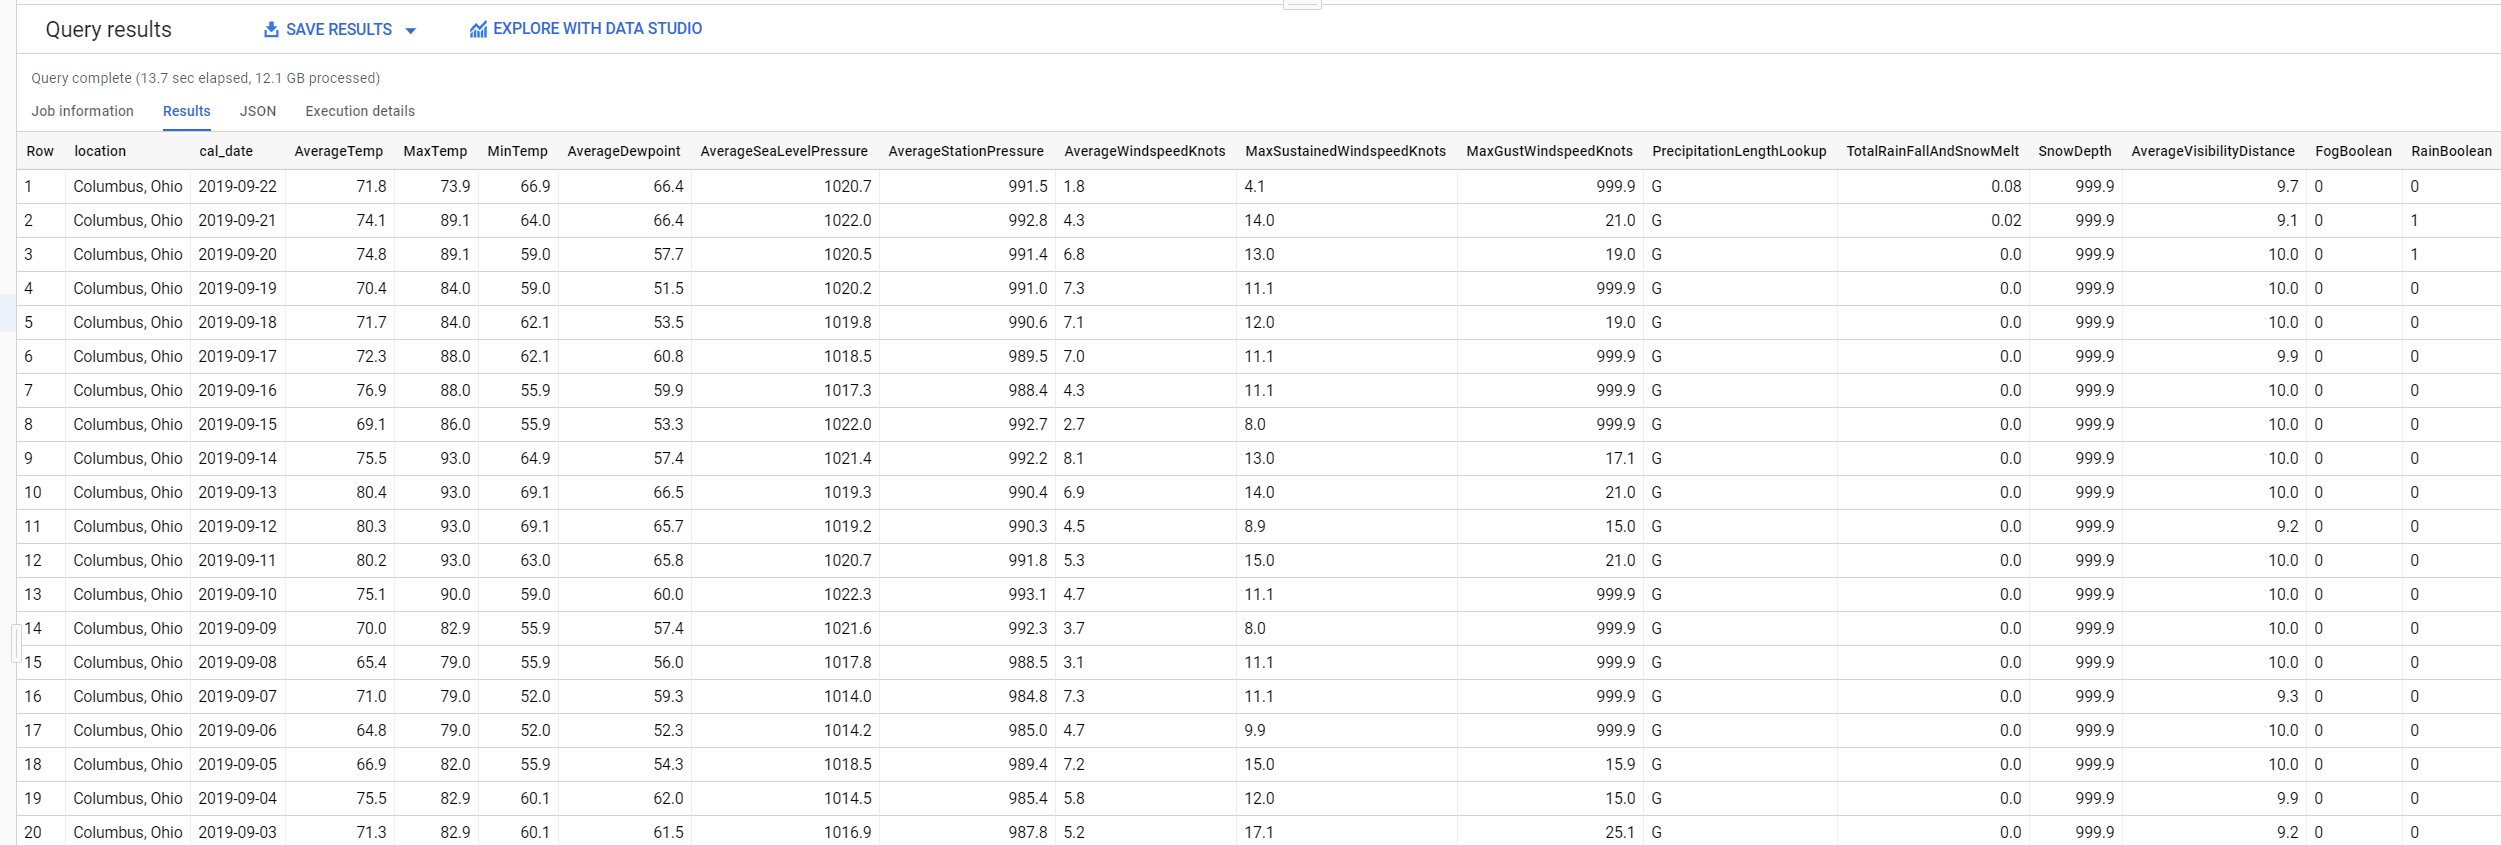
Here is a sample of the results for one location:
Making the world a better place, one SELECT * at a time.