Transform your GROMACS simulation data into publication-ready plots
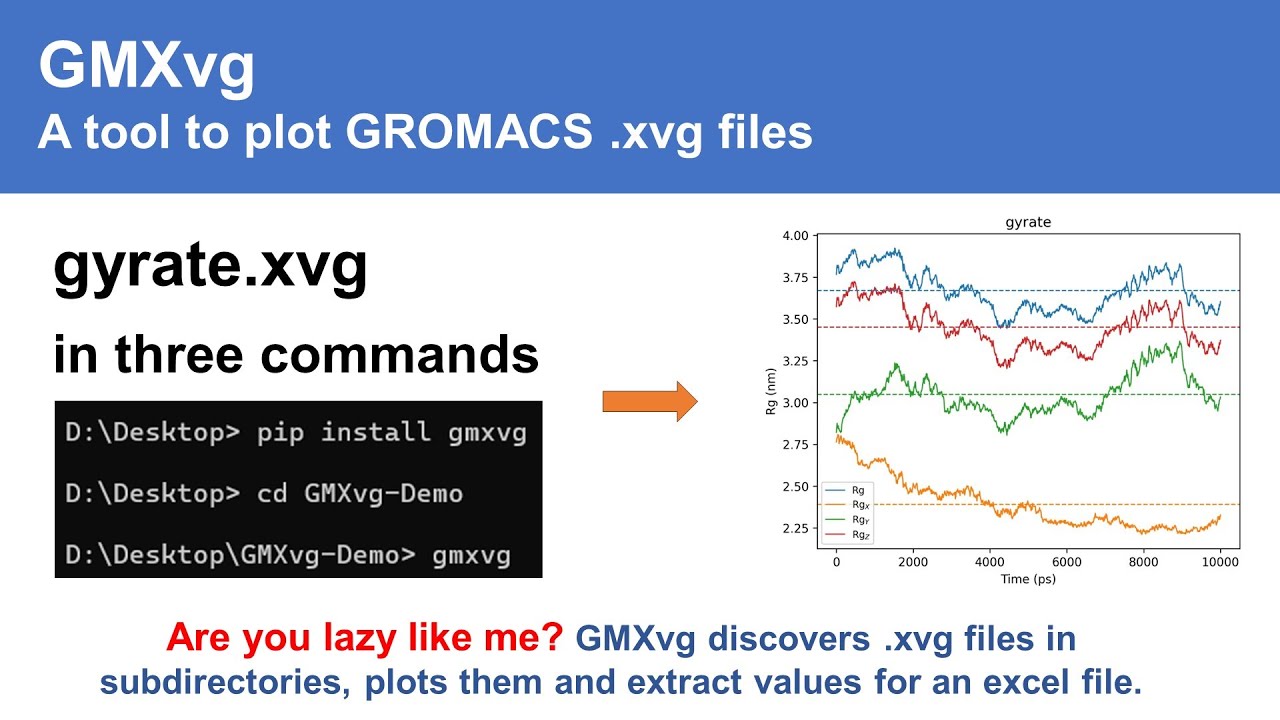
GMXvg is a command-line utility designed for converting and plotting GROMACS XVG files. It simplifies the process of handling XVG files by automatically discovering all XVG files in the current or subdirectories and converting them to specified file formats, with JPG as the default format. Additionally, GMXvg logs the summary of plots in a CSV file, providing quick access to plot values along with their standard deviation.
- Automatic discovery - Finds all .xvg files in directories
- Multiple formats - Export to JPG, PNG, PDF, SVG, and more
- Batch processing - Analyze hundreds of files at once
- Statistical summaries - Automatic calculation of means and standard deviations
- Customizable - Full control over plot appearance and output quality
- Cross-platform - Can be installed and used on Windows, MacOS, and Linux
Install using PIP repository:
pip install gmxvgOr install directly from GitHub:
pip install git+https://github.com/TheBiomics/GMXvg.gitFor version
gmxvg --versionOr options
gmxvg -hOr dry run (It will download xvg example from GitHub and plot them, and store them in your desktop, look at console message)
gmxvg-test# If you have .xvg files in your current folder:
gmxvg
# Or specify a folder:
gmxvg -b /path/to/your/xvg/filesThat's it! 🎉 Your plots will be created automatically.
GMXvg works with all standard GROMACS output files including:
| File Type | Description |
|---|---|
| RMSD | Root Mean Square Deviation - structural stability |
| RMSF | Root Mean Square Fluctuation - flexibility analysis |
| Energy | Potential, kinetic, and total energy plots |
| Temperature | System temperature monitoring |
| Pressure | System pressure analysis |
| Hydrogen Bonds | Molecular interaction analysis |
# Plot all .xvg files in current directory
gmxvg

# Plot files in a specific directory
gmxvg -b /path/to/simulation/results

# Create high-resolution plots for publication
gmxvg -d 600 72 -e png pdf- Interactive Tutorial - Hands-on examples in Jupyter notebook
- FAQ - Common questions and answers
Watch GMXvg in action:
Click the image above or watch on YouTube
"No .xvg files found"
- Make sure you're in the right directory
- Check if files have the .xvg extension
- Use
-bto specify the correct path or start terminal from the directory containing your graphs
"Import error"
- Try:
pip install --upgrade gmxvg - Make sure you have Python 3.6+
"Plots look strange"
- Check if your .xvg files are properly formatted
- 💬 GitHub Issues: Report bugs or request features
- 📖 Documentation: Full documentation
We love contributions! Here's how you can help:
- Report bugs - Found something broken? Let us know!
- Suggest features - What would make GMXvg better for you?
- Share examples - Help others by sharing your use cases
- Improve documentation - Help make GMXvg even more user-friendly
- Built for the molecular dynamics community
- Powered by python, matplotlib and pandas
- Inspired by the need to make scientific data analysis accessible to everyone
If you use GMXvg in your research, please cite it using one of the following formats:
APA Format:
Sahu, V. K., Rathore, V., Lin, W., Ranjan, A., & Basu, S. (2025). GMXvg: A tool to plot GROMACS .xvg files (Version 1.0.2) [Computer software]. https://github.com/TheBiomics/GMXvg
BibTeX Format:
@software{Sahu_GMXvg_A_tool_2025,
  author = {Sahu, Vishal Kumar and Rathore, Varsha and Lin, Wan-Wan and Ranjan, Amit and Basu, Soumya},
  month = dec,
  title = {{GMXvg: A tool to plot GROMACS .xvg files}},
  url = {https://github.com/TheBiomics/GMXvg},
  version = {1.0.2},
  year = {2025}
}This project is our small contribution to the molecular dynamics community. We believe that powerful data analysis tools should be accessible to everyone - from students learning computational biology to experienced researchers publishing groundbreaking papers. By simplifying the process of creating publication-ready plots from GROMACS data, we hope to save valuable time that can be better spent on scientific discovery.
Ready to start analyzing your molecular dynamics data? Install GMXvg now and create your first plot in under 2 minutes! 🚀