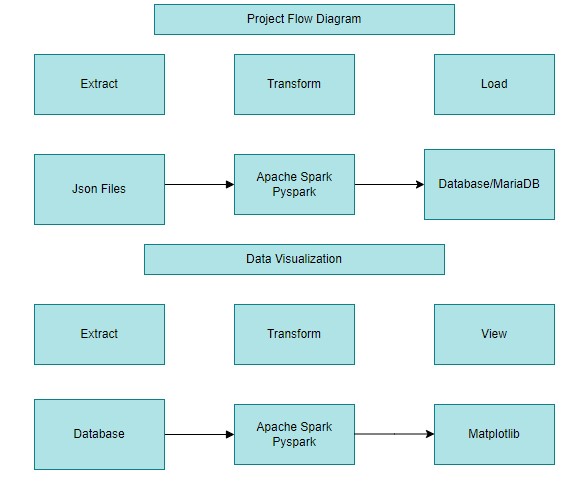
This credit card application project is based on ETL to extract data content from Json file and do data transformation and finally loaded into database. Loaded data will be viewed by the customer based on the menu option selected.
step 1: Extract Data step 2: Expolre the data step 3: Transform
The project is one provided by PerScholas to showcase the learnings of the student throughout the program. There are four datasets as follows to complete the project.
a) CDW_SAPP_CUSTOMER.JSON: This file has the existing customer details. b) CDW_SAPP_CREDITCARD.JSON: This file contains all credit card transaction information. c) CDW_SAPP_BRANCH.JSON: Each branch’s information and details are recorded in this file d)API Endpoint: https://raw.githubusercontent.com/platformps/LoanDataset/main/loan_data.json
Python is the main language used to complete the project. The libraries used to perform ETL are Pandas and Pyspark.Data was transformed from json format to table format using Pyspark. These tables are explored using Pandas and Pyspark to gain an understanding of the data and transformed according to the mapping document provided. Pyspark was then used to build the ETL pipeline. The data sources provided have been cleaned, transformed to create new features and then saved as the data tables. Also the data is read from the database, and plotted into graphs using python library Matplotlib.
The CDW_SAPP_CUSTOMER.JSON,CDW_SAPP_BRANCH.JSON files are extracted into Spark DataFrames and CDW_SAPP_BRANCH.JSON is extracted into Pandas DataFrame. The Loan application Data API is accessed using REST API by sending an HTTP request and processing the response.
Using Spark methods show(),columns(),and Pandas method info(),describe(), head() the data is explored
The data is transformed according to the maooing document provided.
- Converted the first and last name to title case using initcap() and middle name to lower case using lower() in spark withcolumn()
- Concatenated Apt no and street name using concat()
- Formatted the phone number in Regex.
- Dropped the columns after cancatenation.
- Change the datatype of column using cast() and astype() in pandas.
- Convert the date format in to specified (YYYYMMDD) format.
- Replaced null values in zipcode column into 99999.
After transformation data is loaded into MariaDB using SparkSQL connection. Also used python database connectivity for customer modification module.
Data is read from database usig spark SQL read.format. The data is loaded into pandas dataframe and used Matplotlib for platting the graph.
- Python 3.10
- Apache Spark
- Python(Pandas,Matplotlib)
- Maria DB
- clone the project to your local directory
Padmapriya Radhakrishnan