


Unless you live on the moon you probably used Waze for navigation when driving. The app’s ability to plan the best route and react to new events made it popular. But merely reacting to events isn’t enough - the ultimate goal is to predict events and solve congestion problems before they occur.
As part of The Hebrew University of Jerusalem course "Introduction to Machine Learning (67577)", the four of us participated in a hackathon, determined to answer the following questions:
- What is the most likely next event given a sequence of Waze events?
- What is the distribution of Waze events in a given time point?
The dataset holds about 18K real traffic events from the Waze application, collected between 2021-02-07 to 2022-05-24. Each row describes a single event and hold 19 features:
| Feature | Description | Type | Example |
|---|---|---|---|
| id | Unique identifier for the event Cell | int | 16519 |
| linqmap_type | describing the event family | string | JAM |
| linqmap_subtype | describing the event in details | string | JAM_STAND_STILL_TRAFFIC |
| pubDate | the report date | string | 05/15/2022 09:31:17 |
| linqmap_reportDescription | description of the event (Hebrew) | string | - |
| linqmap_street | the street name (Hebrew) | string | תל אביב - יפו |
| linqmap_nearby | interest points near the event (Hebrew) | string | שתולים |
| linqmap_roadType | road type code | string | 6 |
| linqmap_reportMood | user mood (as assessed by Waze) | string | 0 |
| linqmap_reportRating | report rating | int | 5 |
| linqmap_expectedBeginDate | event expected beginning | string | - |
| linqmap_expectedEndDate | event expected ending | string | - |
| linqmap_magvar | orientation w.r.t to the north pole | int | 244 |
| nComments | comments | string | 0 |
| linqmap_reliability | event reliability | int | 9 |
| update_date | when the event was last updated | string | 1652608382312 |
| x | x coordinate of the event | int | 180774.21999999974 |
| y | y coordinate of the event | int | 661479.4800000004 |
*The only features that are guaranteed to be present are ID, linqmap_type, x, y.
**The dates are given in POSIX time.
As mentioned, in this Hackathon we were asked to answer 2 independent question. Therefore, this program runs 2 independent task:
- Predict Next Event.
- Predict Event Distribution.
Given a sequence of 4 consecutive events in Tel-Aviv (ordered by time) predict the next event.
That is, given a sequence of 4 events
The input for this problem is a dataframe with groups of 4 events in Tel Aviv with same structure as the training data and a number indicating which group they belong to (the last column).
The output is a dataframe with a single row per group and 4 columns corresponding to the values above.
In this section the evaluation method is a weighted combination of F1-macro loss for
linqmap_type, linqmap_subtype and l2 loss for the location -
Given a time range (start-end) predict the distribution of events across the nation. That is, for the following 3 time slots 8:00-10:00, 12:00-14:00, 18:00-20:00 predict the number of events of each type.
The input is one of the dates: 05.06.2022, 07.06.2022 and 09.06.2022.
The output is a 3 by 4 table where each row corresponds to a time slot, the columns match the linqmap_type (ACCIDENT, JAM, ROAD_CLOSED, WEATHERHAZARD).
In this section the grading is computed by the following weighted MSE:
Our model requires Python 3.7+ to run.
-
Clone the repo and enter the project directory:
git clone https://github.com/OrrMatzkin/IML.Hackathon.Waze.git cd IML.Hackathon.Waze -
Install and run a virtualenv, isolated Python environment (this step is not mandatory but recommended):
pip3 install virtualenv virtualenv IML.Hackathon.Waze source IML.Hackathon.Waze/bin/activate -
The
requirements.txtfile lists all Python libraries that our program depends on, they will be installed using:pip3 install -r requirements.txt
The program is set to run both tasks. The program needs data to train its models, the Next Event Prediction task
also needs take_features sequences of 4 consecutive events. Therefore, the program requires 2 arguments in total to run
(we already supplied real time data):
python3 main.py data/waze_data.cvs data/waze_take_features.csvWhile the program runs it will update you of its stage. After the program would train the models it will run both tasks and save the prediction as csv, as defied in the tasks section.
In the next few sections we will walk you through how are program and models work.
Before even approaching the task, we saved 20% of the data for a last minute test, as the data we have been given is precious and of-course limited.
Then we looked and examined the Data, we wanted to figure out what features we hold and how the data is represented. We found out that we have two types of dates, many features about location and little data about the reporters themselves.
Before we tried to understand what features we wish to keep and what new one to create by computing the correlation between them, we cleaned the data with a couple of ways including:
- Getting rid of duplicates (by id).
- Filling missing data by analyze same samples with close destination and time to the area
- Converting dates to date format.
- Finding correlation between subtypes and location inside and outside of town.
- Creating dummies values for non-numeric features
- And many more...
One example of what we succeeded to learn from the raw data is where most of the events (by type) occurs geographically. We saw by to printing (x,y) location of events that most of the jams are in Tel-Aviv (no surprise here).

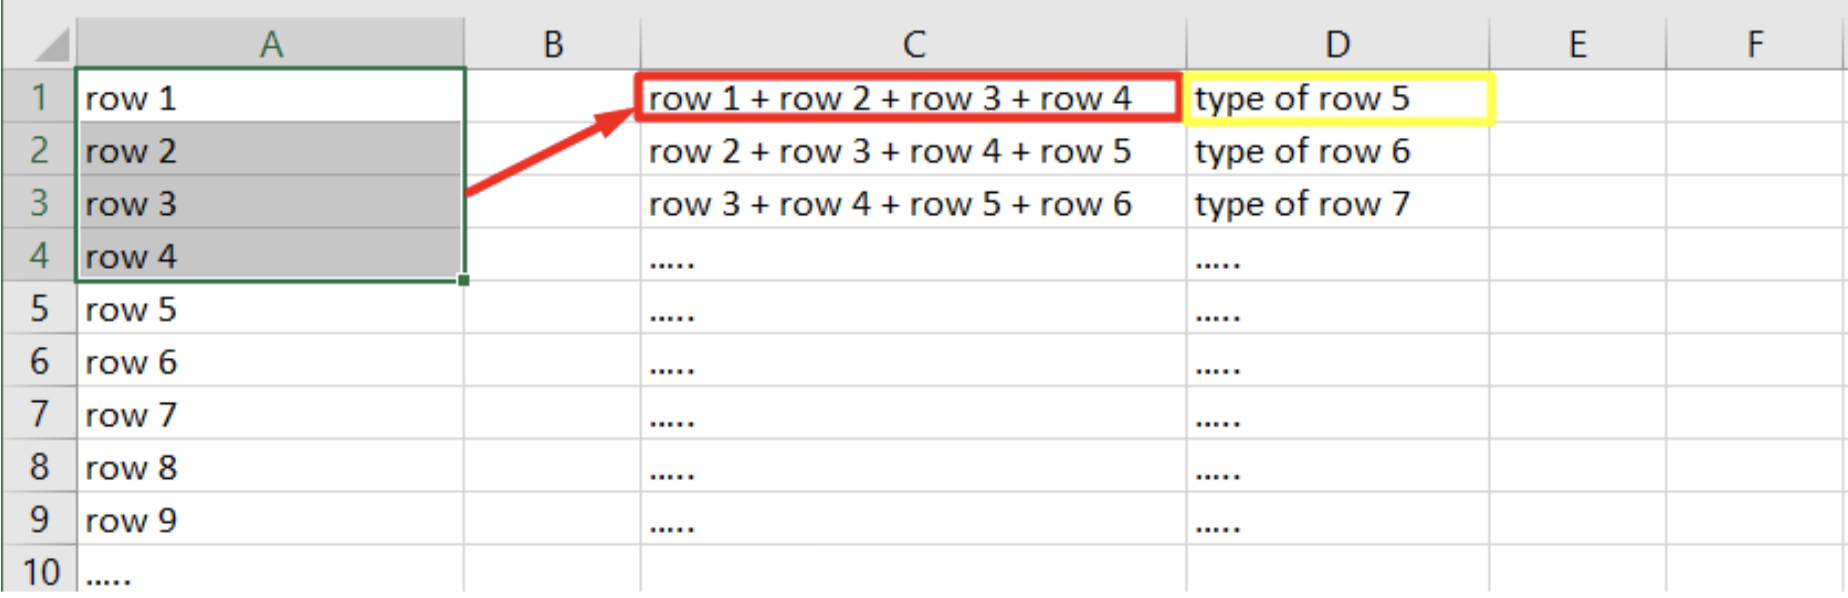
For fitting and predicting each quartet (4 samples) we took every sequence of 4 consecutive samples and convert them into one sample. The label was the type, subtype, x coordinate and y coordinate. This way we can build models with samples and labels as we want.
Each sample (quartet, from now on) goes through two models,: one for the type and a second model for the subtype that assumes the sample has a specific type. With the samples represented as 4 samples inside each sample and the labels from the corresponding sample we get the “simple” model. To choose a model we split the train data to validation data and new train data. The new train data has been used for fitting each model and checking how good the prediction on the validation data.
To understand the best version of each family of models we used K-fold. We got the best hyperparameter that best predict the new train data.


The model of type got the best result from ExtraTreeClassifier. The 4 models of subtype got the best result from ExtraTreeClassifier. The 2 models of X and Y coordinates got the best result from RandomForsetRegressor
Each sample is 4 samples combined as one sample. Each label is the type of the consecutive sample of the 4 samples from the dataset. For Each Type we made a new model with multi-class as label. So each label could be one of the subtypes of each type.
We got 0.62 on the train with f1 macro and 0.28 on the test (while the test has been checked only after we finished the work).
We chose to analyze the data by day of week and time slots in each day. Then we calculated the average of events in each time slot, the average calculated by the number of days the data has been gathered from and number of events from each type.
Thank you for reading and showing interest in our hackathon project... Keep in mind, we don't need any contribution to this project whatsoever.
MIT License
Copyright (c) 2022 OrrMatzkin
Permission is hereby granted, free of charge, to any person obtaining a copy of this software and associated documentation files (the "Software"), to deal in the Software without restriction, including without limitation the rights to use, copy, modify, merge, publish, distribute, sublicense, and/or sell copies of the Software, and to permit persons to whom the Software is furnished to do so, subject to the following conditions:
The above copyright notice and this permission notice shall be included in all copies or substantial portions of the Software.
THE SOFTWARE IS PROVIDED "AS IS", WITHOUT WARRANTY OF ANY KIND, EXPRESS OR IMPLIED, INCLUDING BUT NOT LIMITED TO THE WARRANTIES OF MERCHANTABILITY, FITNESS FOR A PARTICULAR PURPOSE AND NONINFRINGEMENT. IN NO EVENT SHALL THE AUTHORS OR COPYRIGHT HOLDERS BE LIABLE FOR ANY CLAIM, DAMAGES OR OTHER LIABILITY, WHETHER IN AN ACTION OF CONTRACT, TORT OR OTHERWISE, ARISING FROM, OUT OF OR IN CONNECTION WITH THE SOFTWARE OR THE USE OR OTHER DEALINGS IN THE SOFTWARE.BS7HXHXp0QKBBe6sNYvjJZ0/edit?usp=sharing).