The details of the requirements for this project are outlined in this project spec.
The live site can be found here.
FitLit is a sample fitness application providing mock user data to a mock user at a glance. This was the partner project for our time during Mod 2 at the Turing School of Software and Design. The purpose of this application is to provide a sample fitness style dashboard that utilizes classes and methods to calculate and display data and external libraries to display the data on the DOM.
Our user data is hosted locally within the project files. There are fifty sample users that span roughly 3 months of daily data across multiple categories. Data is made up of activity, hydration, and sleep information. Each category is displayed on the webpage in a corresponding dashboard. All data visualizations are constructed using d3.js. The site is optimized for small mobile, large mobile, tablet, and laptop devices.
There is no installing required as our only dependency was utilized via CDN.
- Test Driven Development
- Incorporating 3rd party libraries to display data
- Expanding our understanding of DRY JavaScript, separate DOM and Data Model components, and HTML/CSS design
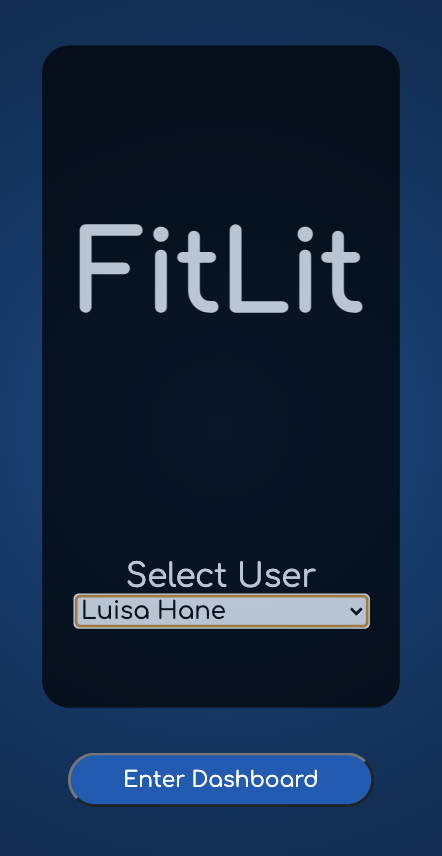
First, select a sample user from the drop down and click 'Enter Dashboard' to be taken to the dashboard for that specific user.
Once on the dashboard, the user is welcomed. The profile button on the top right will take you to the profile screen for that user. The nav buttons can take you to different dashboards depending on the type of data you're looking to view. The current dashboard button is styled accordingly to let the user know what page they are viewing.
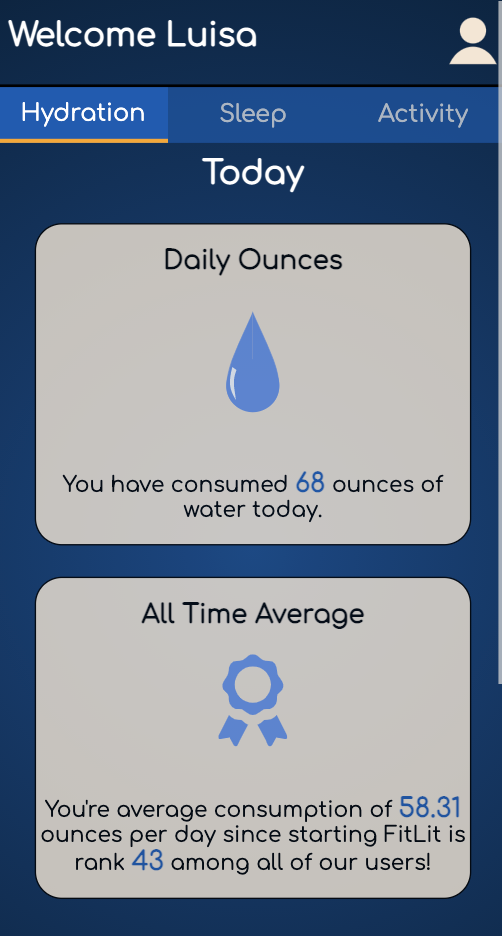
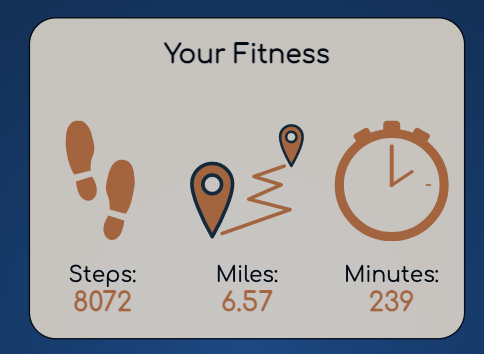
Each dashboard is made up of several widgets including current daily information, weekly information, all time averages, and comparisons amongst all other users. Navigate between the dashboards to see the different widgets. The color of graphics and text correspond to the category of information being viewed as well.

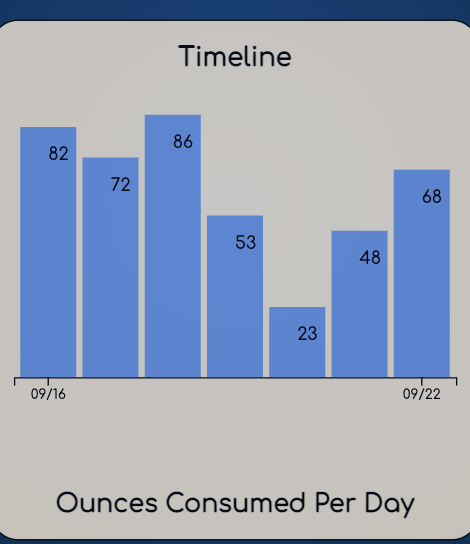
The graphs are dynamic and can be changed by selected the radio button or check boxes on their respective widgets. The graph reloads with a fun animation.

Additionally, a user change select the range of dates to be displayed if they wish to view something other than a one week range.
There is no local storage so to choose a different user, simply refresh the page.
The big takeaway from this project was utilizing d3.js to create our graphs. Neither of us had any prior experience with this library and through countless hours of YouTube tutorials and stackoverflow questions we were able to create a dynamic bar chart tailored to our needs for this project. We elected to include numbers corresponding to the values of each bar as opposed to having a y-axis. The scale of the chart is built dynamically to respond to the maximum range of the dataset we are looking at. We incorporated a date-picker so the user has control over the range of data points they see. As the number of bars increases, the position of the numbers changes from the middle of the bar to the start of the bar to help accomodate overflow.
In future iterations we would like to spend more time on the styling of the project and on the functionality of our charts. We feel that because we attempted to take on something so challenging we were unable to spend as much time making the site look pretty as we did making the charts function the way we wanted them too. There are countless ways to express data visually on a page and we hope to continue learning and working with d3.js to create even more exciting visuals.
This project was written using HTML, CSS, and JavaScript.
Unit testing was accomplished through node.js using Mocha and Chai.
We utilized the d3.js library to create our graph displays of users' weekly data.
Aside from the water droplet on the Daily Ounces widget which was created by hand, all svg images were obtained from freesvg.org