Make a regression predictive model to predict the car price. Data source : https://www.kaggle.com/hellbuoy/car-price-prediction?select=CarPrice_Assignment.csv
• Seek insight from the dataset with Exploratory Data Analysis
• Performed data cleansing, data processing, data engineering to prepare data before modeling
• Built a model to predict the car price
| Variable | Type | Definition |
|---|---|---|
| id | Numeric | Unique car ID |
| symbol | Categorical | Assigned insurance risk rating (+3 is risky, -3 is safe) |
| name | Categorical | Name of car company |
| fuel | Categorical | Car fuel type |
| aspiration | Categorical | Aspiration used in a car |
| door | Categorical | Number of doors |
| body | Categorical | Body of car |
| wheel | Categorical | Type of drive wheel |
| engineloc | Categorical | Location of car engine |
| wheelbase | Numeric | Wheelbase of car |
| length | Numeric | Length of car |
| width | Numeric | Width of car |
| height | Numeric | Height of car |
| weight | Numeric | Weight of a car without occupants or baggage |
| engine | Categorical | Type of engine |
| cylinder | Categorical | Cylinder number placed in the car |
| enginesize | Numeric | Size of car |
| fuelsystem | Categorical | Fuel system of car |
| boreratio | Numeric | Boreratio of car |
| stroke | Numeric | Stroke or volume inside the engine |
| compressionratio | Numeric | Compression ratio of car |
| hp | Numeric | Horsepower |
| peakrpm | Numeric | Car peak rpm |
| citympg | Numeric | Mileage in city |
| highwaympg | Numeric | Mileage on highway |
| price | Numeric | Price of car |
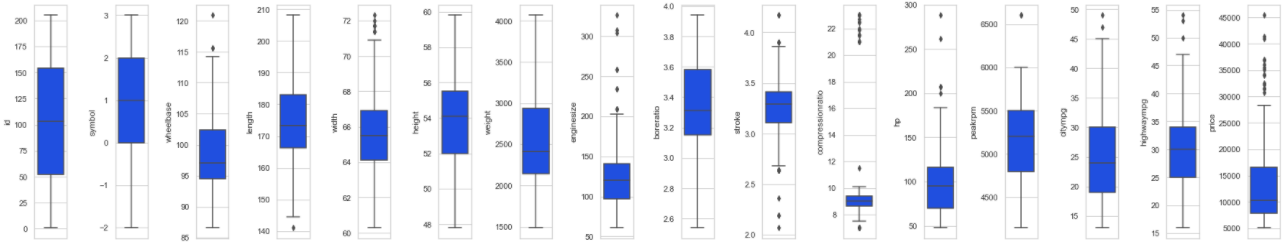 There are outliers in
 wheelbase, with, enginesize, stroke, compressionration, hp, peakrpm, highwaympg, and price.
Overall the features has normal distribution.
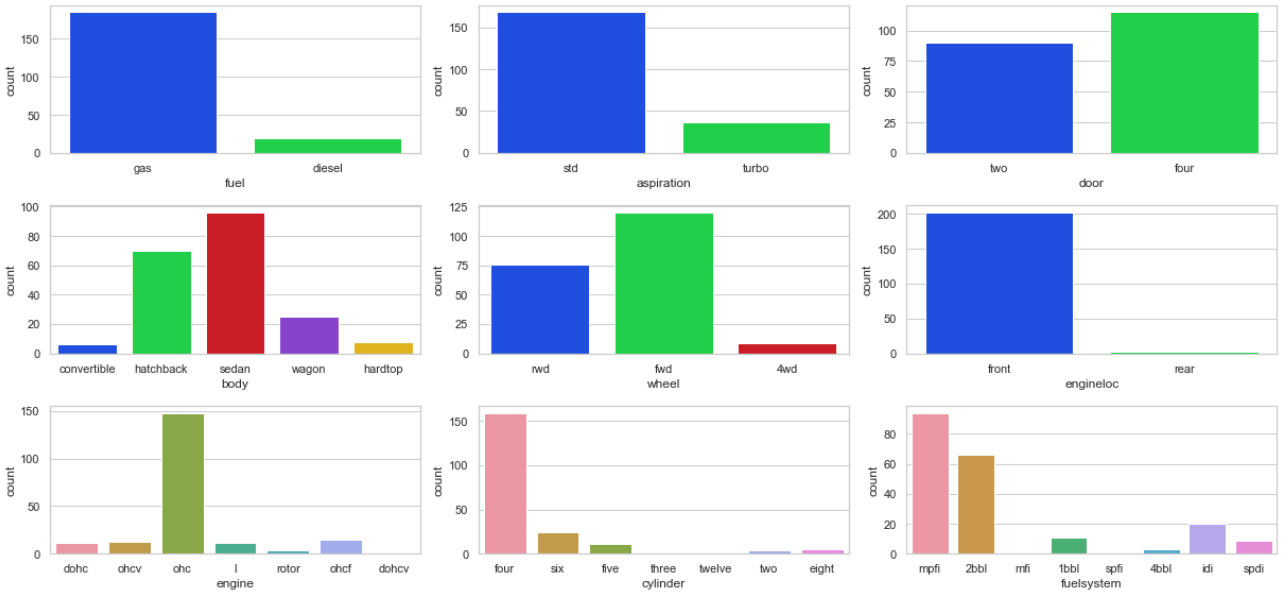 Based on
 fuel, door, body, wheel, engine, cylinder features, majority is a city cars.
• Check missing & duplicate values
• Replace all features that have an outliers with IQR limit
• Ordinal encoding for door & cylinder features
• Feature encoding the rest of categorical columns
• Drop categorical features that encoded before
• Normalize all selected features
• Split features & target
• Split data into data train & data test
• Train model with 4 different algorithm such as Linear Regression, Random Forest, Decision Tree, and SVR
• Evaluate model with MAE Score, RMSE Score & R2 Score
• Validate model with train and test accuracy
• Hyperparameter tuning
• Select the best model
| Score | Linear Regression | Decision Tree | Random Forest | SVR |
|---|---|---|---|---|
| MAE | 0.06 | 0.05 | 0.03 | 0.07 |
| RMSE | 0.09 | 0.07 | 0.05 | 0.09 |
| R2 | 0.80 | 0.88 | 0.94 | 0.82 |
| Train Acc | 0.93 | 0.99 | 0.98 | 0.87 |
| Test Acc | 0.80 | 0.87 | 0.94 | 0.82 |
Based on predictive modeling, Random Forest algorithm has the best score compared to the other algorithms.
Random Forest make a prediction with the lowest error, MAE Score 0.03, RMSE Score 0.05, and the highest R2 Score 0.95.
The algorithm is fit based on the train & test accuracy score (0.98 - 0.94).