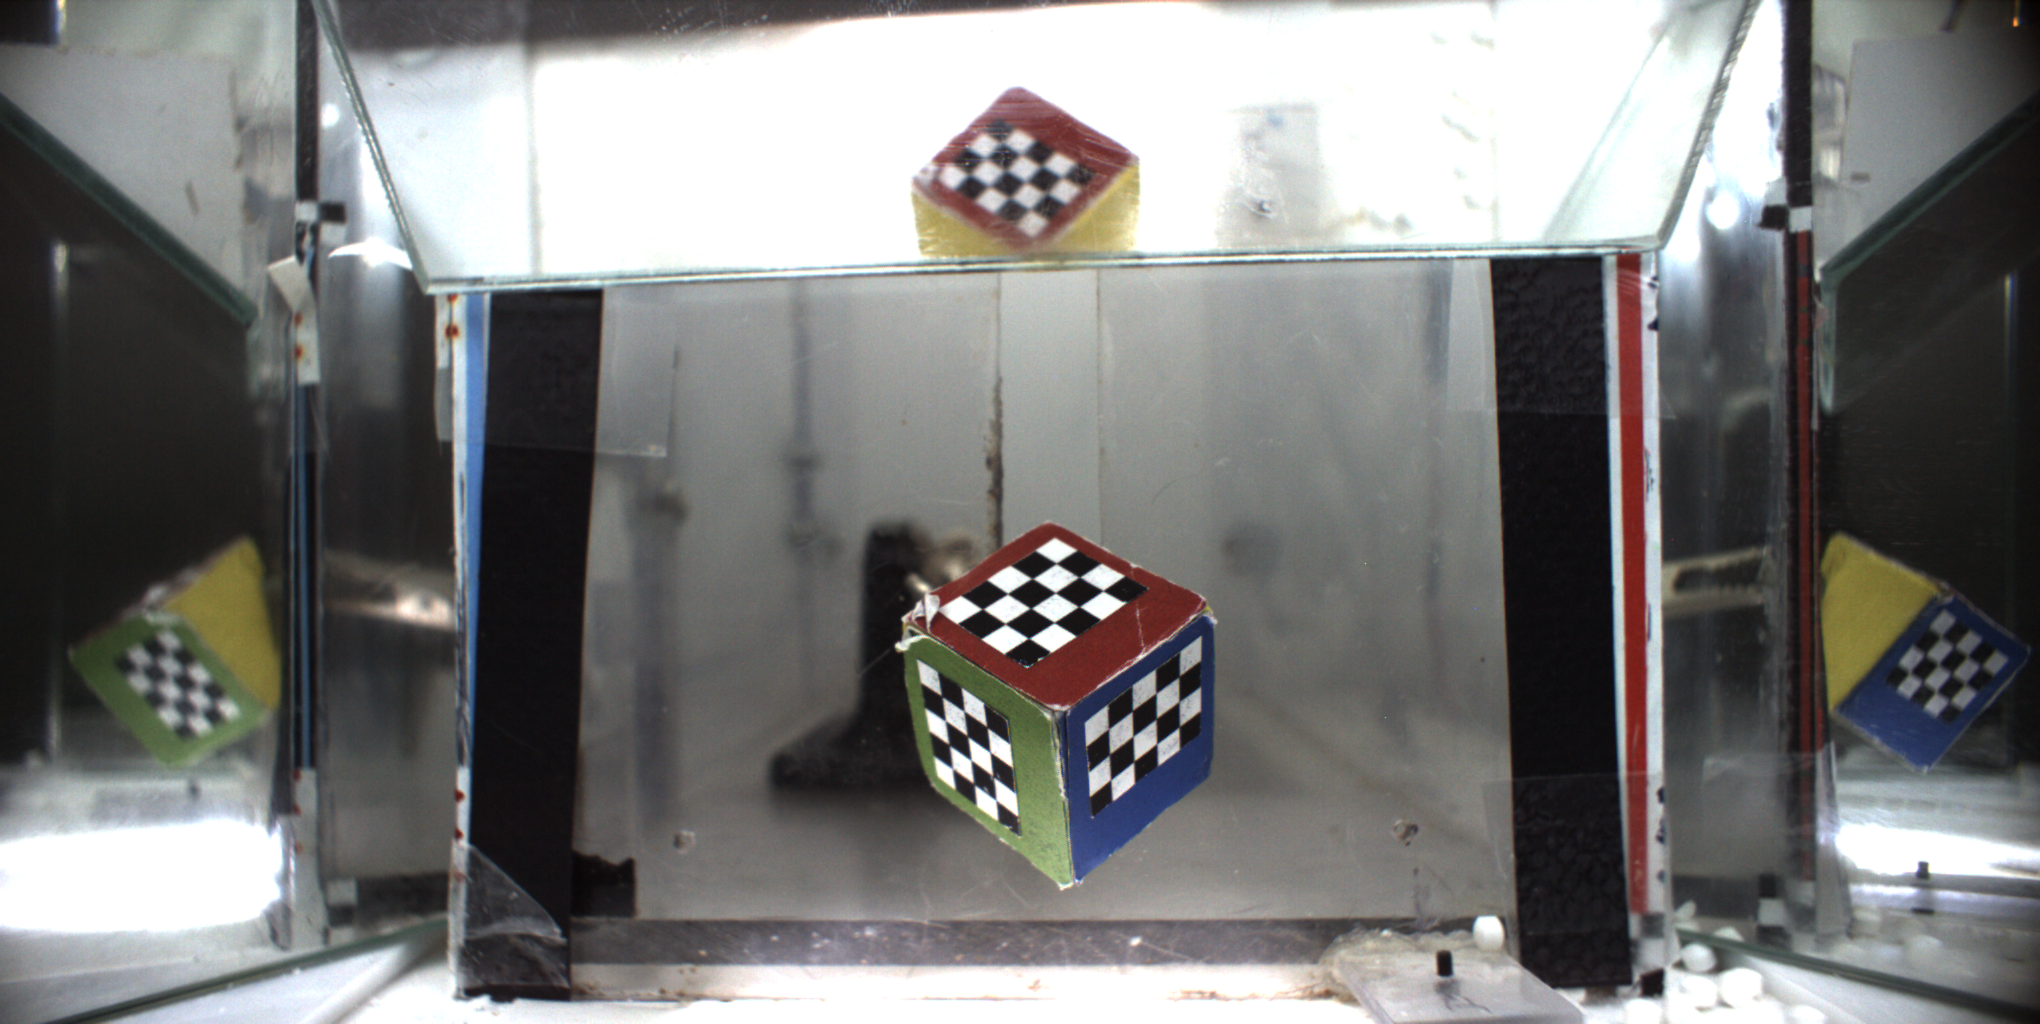
boxCalibration is a toolbox for creating reconstruction parameters, used in combination with DeepLabCut to obtain 3D rodent reaching parameters. There is, however, nothing specific that makes this toolbox only applicable to DeepLabCut data. Any calibration images with a multi-sided checkerboard and mirror view (at least one) can be used. For further details regarding the calibration images required, see references below.
To install this toolbox, simply download the repository and add it to your MatLab pathway. This software was developed on MatLab R2018b and has been tested on R2017b. Several MatLab toolboxes will also be required:
- Optimization Toolbox
- Computer Vision System Toolbox
- Image Processing Toolbox
- Collect all calibration images in the same folder.
- Using ImageJ, manually mark all checkerboard points for each calibration image. Save this image with the name “GridCalibration_YYYYMMDD_#.tif” where ‘YYYYMMDD’ is the date the calibration image corresponds to and ‘#’ is the image number for that date.
- Use the measurement function in ImageJ (in the toolbar, select “Analyze” and then “Measure”). This will display a table containing coordinates for all points marked. Save this file with the name “GridCalibration_YYYYMMDD_#.csv”, where the date and image number are the same as the corresponding .tif file.
- From the boxCalibration MATLAB package, open the ‘setParams.m’ file. This file contains all required variables and their description. Edit variables as needed to fit your project’s specifications. For detailed explanation of variables and their default values, see the setParams: Variable Definitions wiki page.
- In MATLAB, run the ‘calibrateBoxes’ script. Several prompts which require responses will appear in the MATLAB command window. The first prompt asks if you want to analyze all images in your folder.
- Typing ‘Y’ will end the prompts and all images for all dates will be analyzed.
- Typing ‘N’ will then prompt you to enter the dates that you want to analyze. These dates should be of the form YYYYMMDD. If multiple dates will be analyzed, separate each date with a comma (e.g., 20190101, 20190102). Note: If the same date is analyzed twice, all files will be overwritten.
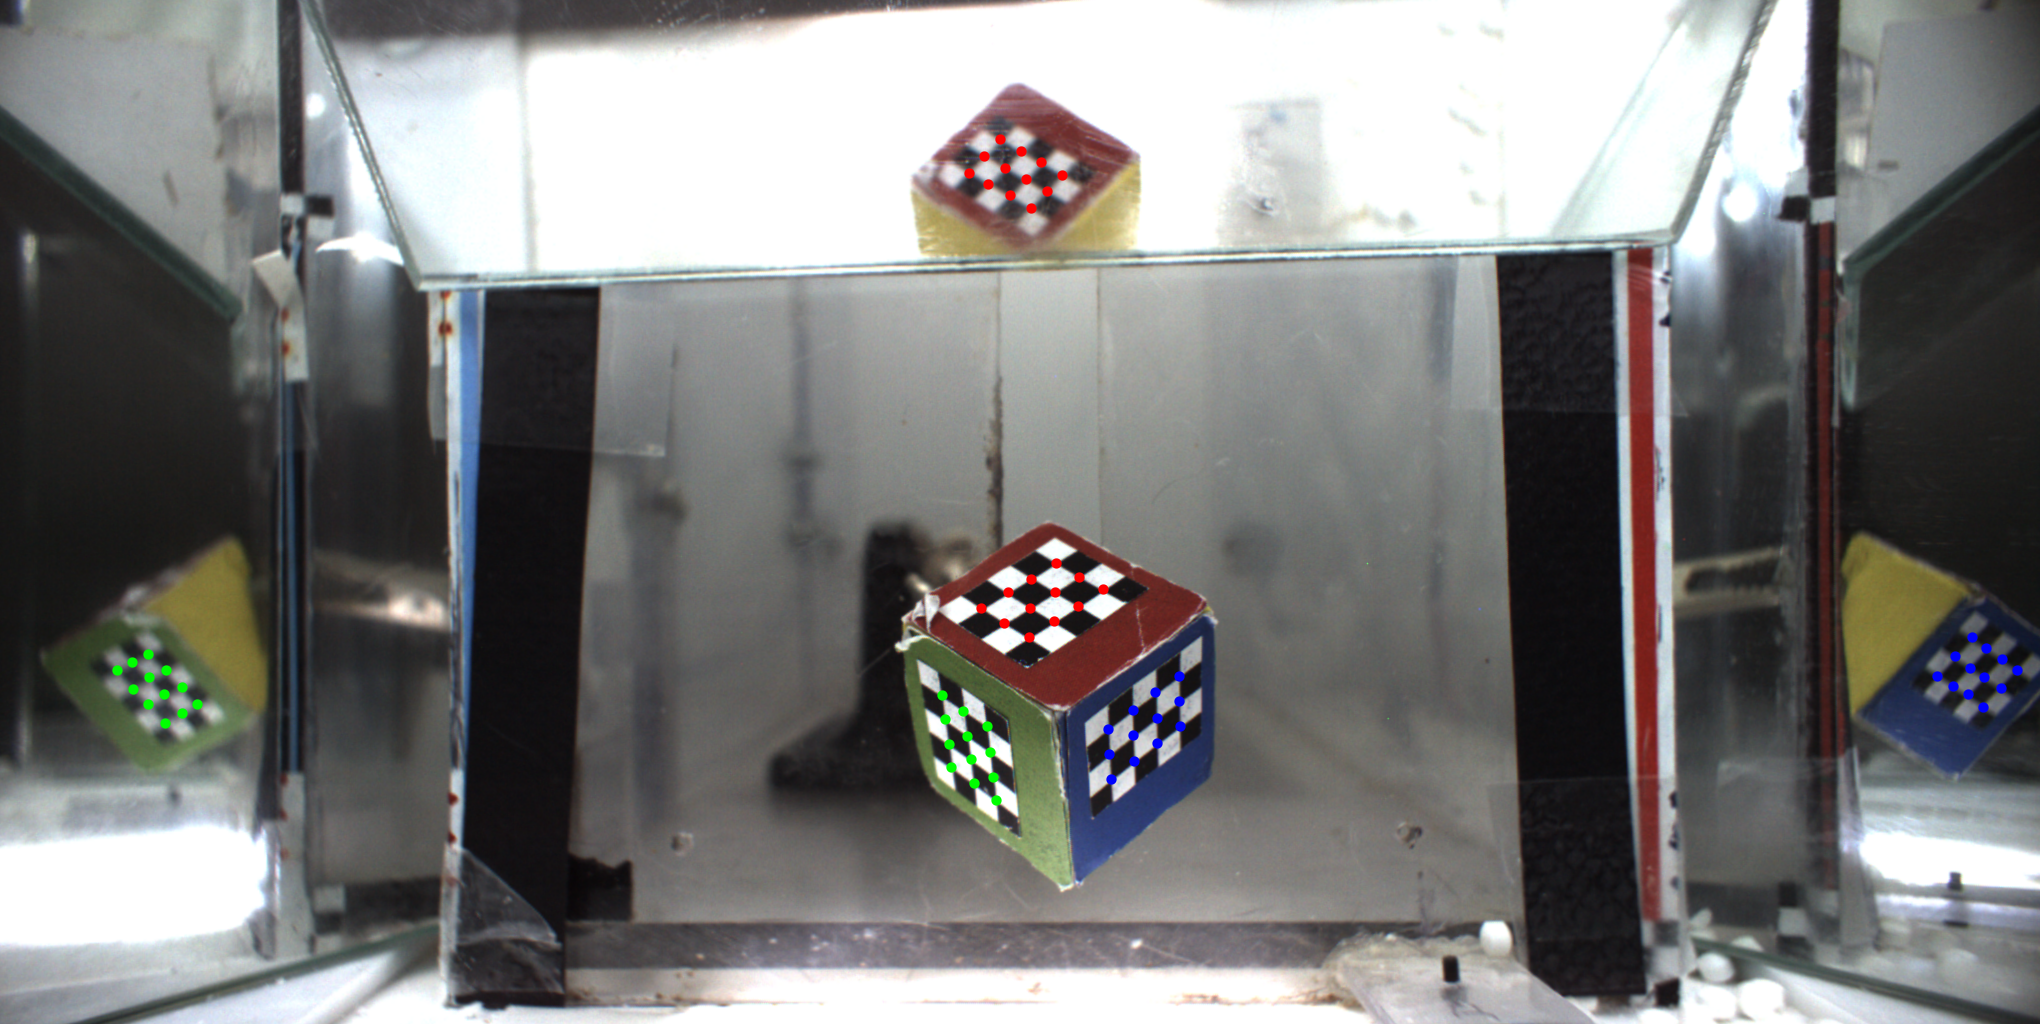
- Two new directories will be created in your calibration images folder following the execution of this script: ‘markedImages’ contains .png files with the user defined checkerboard marks on the calibration image. The ‘boxCalibration’ folder contains the .mat box calibration parameters for each date. Below is an example of what a marked image looks like.
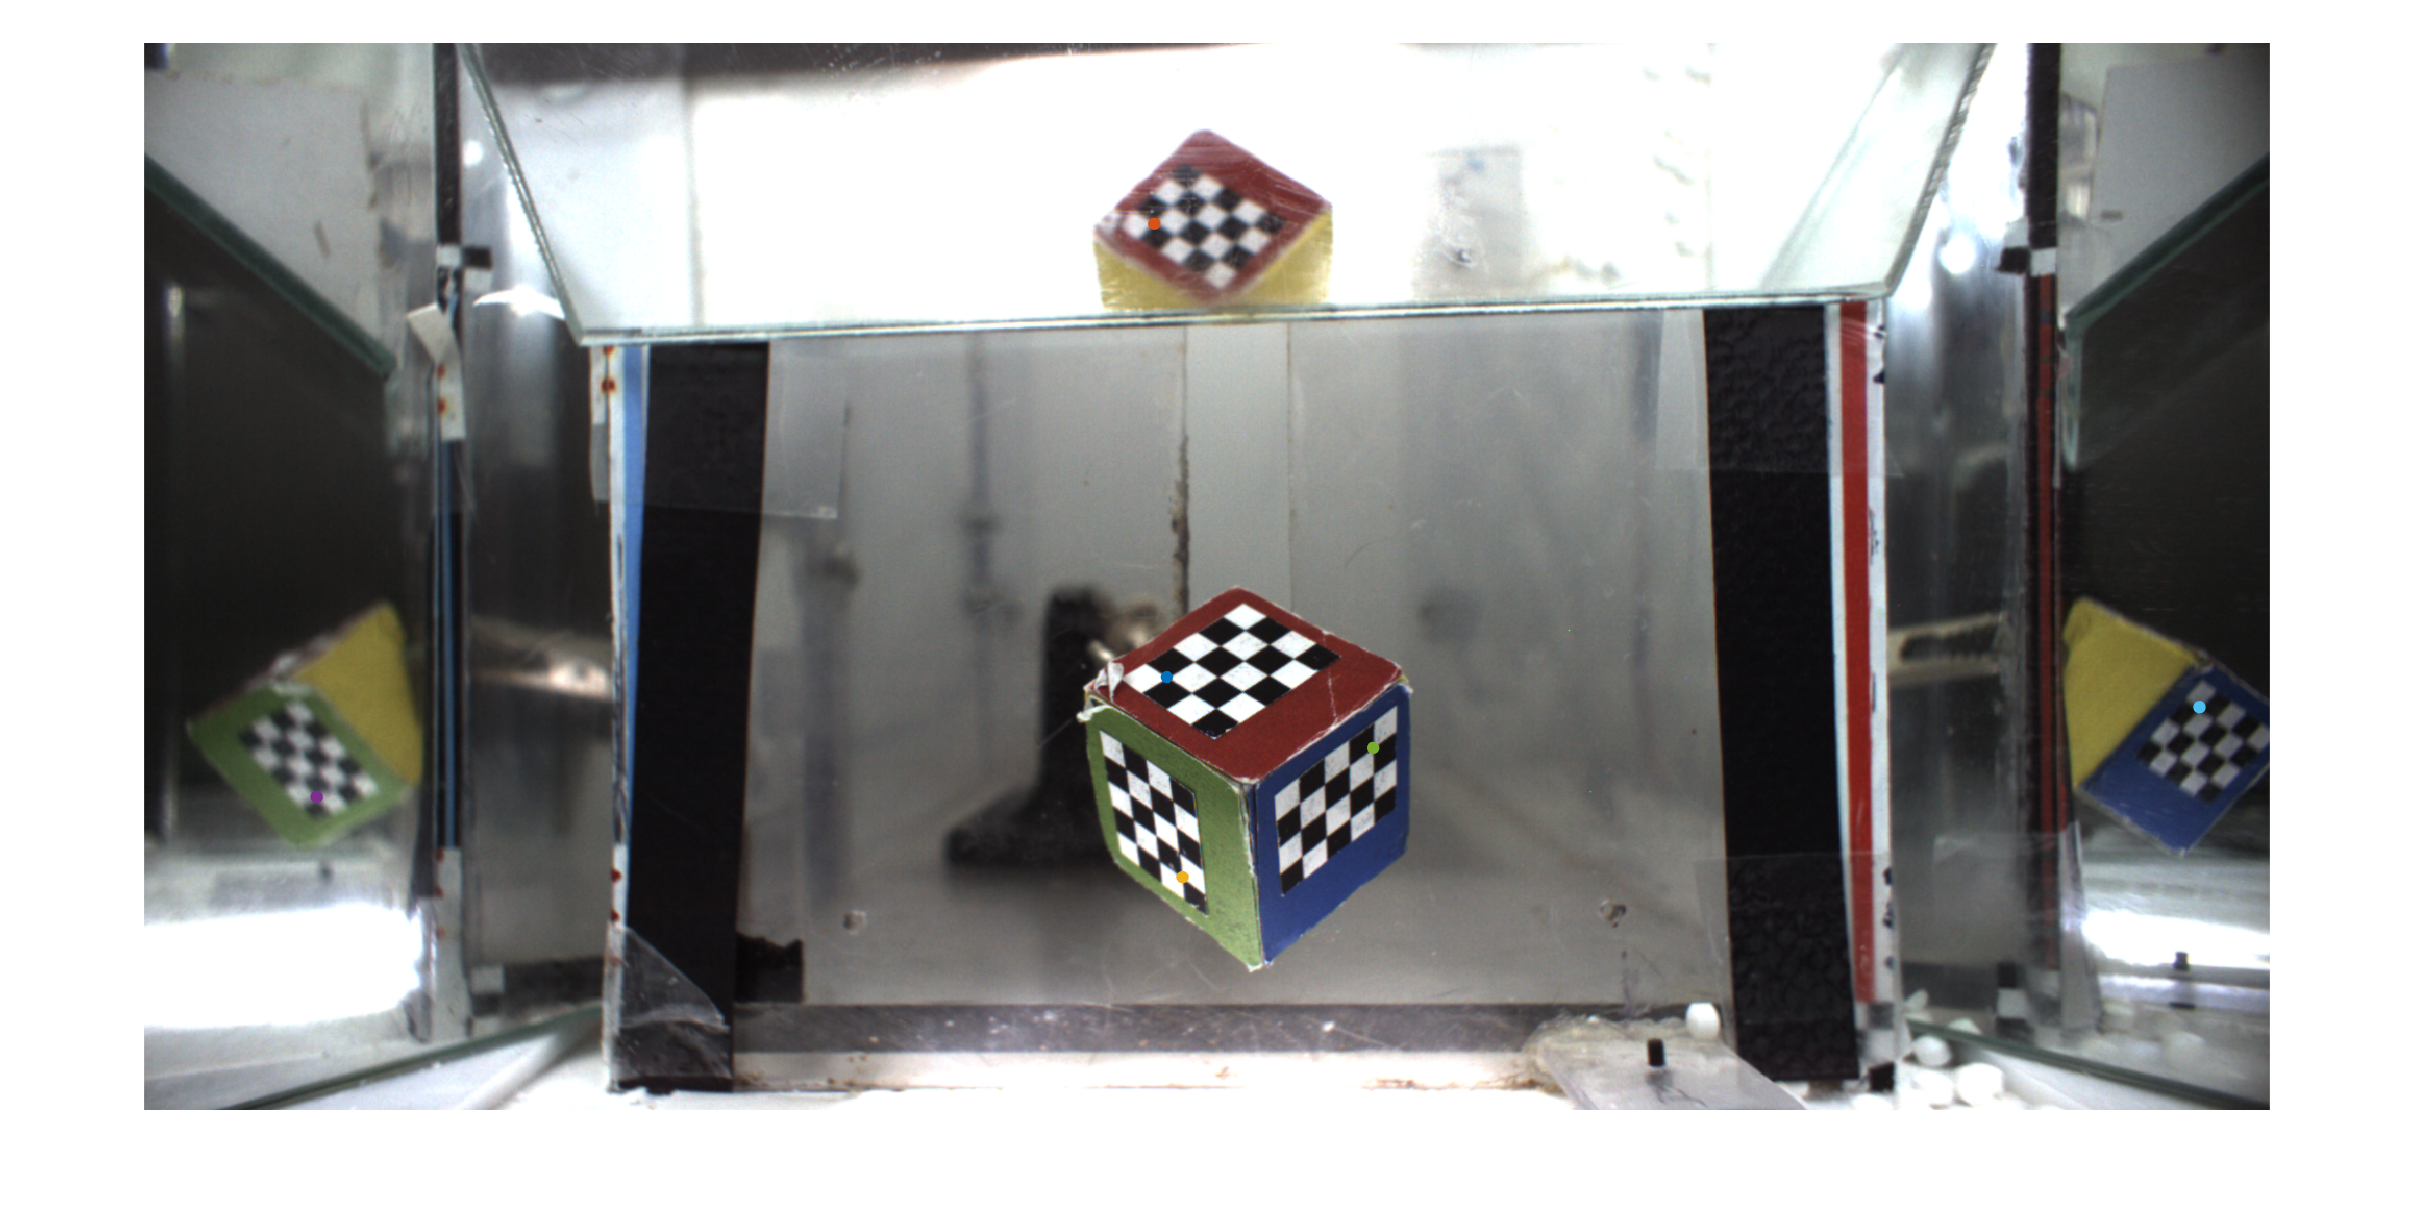
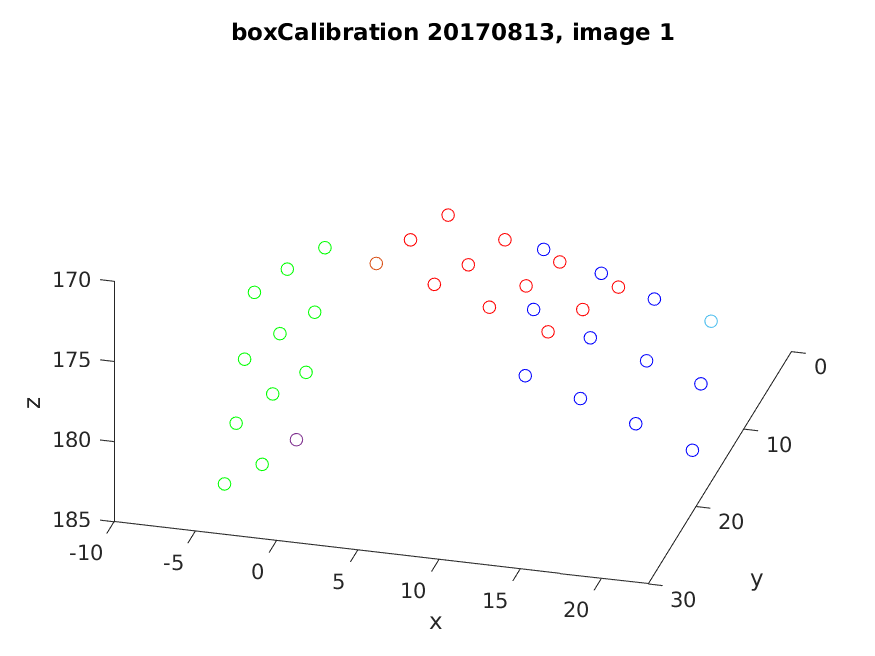
- In MATLAB, run the ‘checkBoxCalibration’ script. The same prompts present in the ‘calibrateBoxes’ script will appear. This will create a new folder, ‘plots’ in the calibration images folder. Each date will have a subfolder containing the images and several MATLAB .fig files, which should be viewed in order to verify that box calibration was completed accurately. Note: Differently colored dots in the calibConfirm_YYYYMMDD_#.png files represent the matched dots in the pointConfirm_YYYYMMDD_#.png files. Example of calibration check:
- For further details, please see our script and function documentation.