Scheduled Message delivery implementation in Apache Kafka using micro services. The scheduled messages are grouped in Apache Kafka's storage based on their scheduled time of delivery.
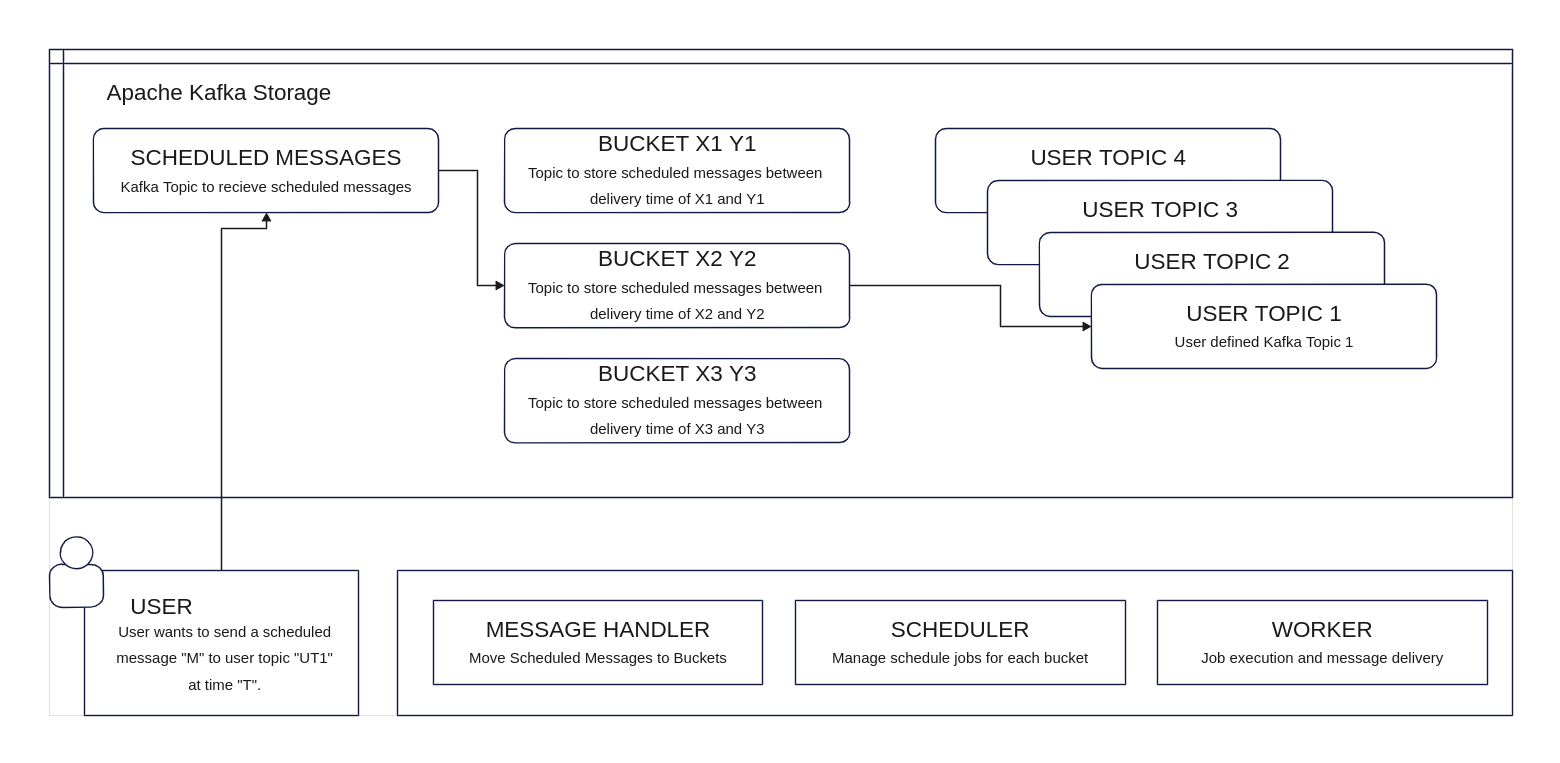
Scheduled messages can be inserted into Kafka like a normal message but with custom headers to a special pre-defined topic as shown below. The ‘time’ header stores the scheduled time of delivery of the message and the ‘topic’ header consists of the actual Kafka topic to the message needs to be published to.
headers = {
            ‘time’ : ‘1 Sep 2023 18:40 CET’,
            ‘topic’ : ‘USER_DEFINED_TOPIC’,
	  }
producer.send('SCHEDULED_MESSAGES', value=message, headers=headers)
Pre-requisistes for deployment: docker and docker-compose.
Usage: ./messagescheduler [OPTION]...
Build and run the application.
       --help              display this help and exit
       --all               Run all services
       --app               run the kafka message scheduling application alone
       --exp               run experiment according to the configuration in 'experiment.env' file [default option]
       --gui               include the corresponding GUI for each service
       --grafana           enable the Grafana monitoring service
  -c,  --clean             clean the application cache and logs
  -dc, --deep-clean        clean the application and remove all containers
  -p,  --progress          show the progress of the application
  -pl, --progress-live     show the progress of the application
  -s,  --stop              stop the application
For cluster deployment, update the environment variables in the YAML files with corresponding IP addresses of the nodes in the cluster and docker-compose up -d inside each module folder.
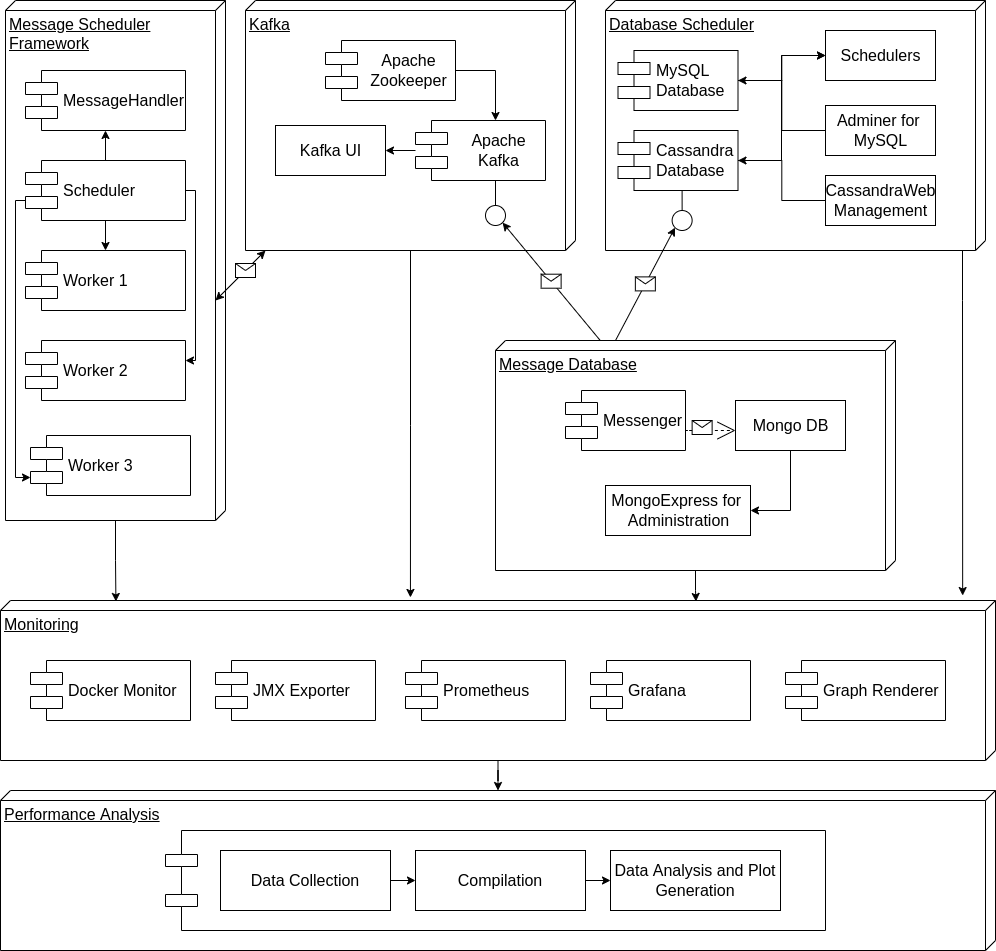
The implementation comprises of 5 modules with different submodules as shown in the above schematic diagram.
The Kafka module incorporates a typical Apache Kafka installation and deploys three services - Apache Kafka, Zookeeper and Kafka-UI.
The message scheduler component consist of Scheduler, MessageHandler and Worker as described in the previous section.
Job Queue: http://localhost:8000/api/jq
Log of Jobs done: http://localhost:8000/api/job_log
Status of Workers: http://localhost:8000/api/wq
The message database module is responsible for generating scheduled messages for Apache Kafka as well as storing it in a database to ensure that Kafka hasn’t dropped any messages as well as ensuring messages are delivered on time. It consists of three modules - Messenger, MongoDB and MongoExpress. The Messenger is accountable for message generation and sending it to Apache Kafka. A copy of it is stored in MongoDB and MongoExpress is used to manage the database.
Message Database Management: http://localhost:8082/
This module implements a traditional approach to scheduling messages using a database and a scheduler. This is deployed for performance comparison with that of Message Scheduler application implemented. It comprises three modules - MySQL Database, Scheduler and Adminer. The MySQL database also receives a copy of the message generated by the ‘Message Database’ module and has a scheduler that queries for messages to send and mark them as delivered. The Adminer module is used to manage the database.
Deployment Yaml
Adminer UI: http://localhost:8090/?server=mysql&username=root&db=MESSAGES
The monitoring module is responsible for collecting as well as visualizing different metrics of all the services deployed. It comprises 5 modules - docker-monitor, JMX-exporter, Prometheus, grafana and grafana-image-renderer.
The docker-monitor is responsible for collecting memory usage, CPU usage, Network usage, Disk I/O and process count. It also collects job queue logs from the Scheduler service in the Message Scheduler module. JMX-exporter is responsible for collecting Kafka and Java-specific metrics. This is collected by Prometheus, a time-series database. The metrics stored in Prometheus are visualised using the Grafana service.
Grafana UI: http://localhost:3000/dashboards
http://localhost:3000/d/aRNaJwOmk/kafka-broker-performance-and-latency?orgId=1&refresh=5s
http://localhost:3000/d/AdG9A1xmk/kafka-brokers-jvm-and-os?orgId=1&refresh=5s
http://localhost:3000/d/zApgMBbik/kafka-hard-disk-usage?orgId=1&refresh=5s
http://localhost:3000/d/e-6AJQOik/kafka-cluster-global-healthcheck?orgId=1&refresh=5s