![]()


GPlately was created to accelerate spatio-temporal data analysis by leveraging pyGPlates within a simplified Python interface. This object-oriented package enables the reconstruction of data through deep geologic time (such as points, lines, polygons, and rasters), the interrogation of plate kinematic information (plate velocities, rates of subduction and seafloor spreading), the rapid comparison of multiple plate motion models, and the plotting of reconstructed output data on maps. All tools are designed to be parallel-safe, accelerating spatio-temporal analysis over multiple CPU processors.
GPlately can be installed using either pip or conda (via the conda-forge channel). For detailed installation instructions, please refer to the Installation section. Additionally, Docker images are available for your convenience.
Sample data is available from EarthByte servers, which include rasters, seafloor age grids, rotation files, and more to help you get started with plate reconstructions.
Mather, B.R., Müller, R.D., Zahirovic, S., Cannon, J., Chin, M., Ilano, L., Wright, N.M., Alfonso, C., Williams, S., Tetley, M., Merdith, A. (2023) Deep time spatio-temporal data analysis using pyGPlates with PlateTectonicTools and GPlately. Geoscience Data Journal, 1–8. Available from: https://doi.org/10.1002/gdj3.185
@article{Mather2023,
author = {Mather, Ben R. and Müller, R. Dietmar and Zahirovic, Sabin and Cannon, John and Chin, Michael and Ilano, Lauren and Wright, Nicky M. and Alfonso, Christopher and Williams, Simon and Tetley, Michael and Merdith, Andrew},
title = {Deep time spatio-temporal data analysis using pyGPlates with PlateTectonicTools and GPlately},
year = {2023},
journal = {Geoscience Data Journal},
pages = {1-8},
keywords = {geospatial, plate reconstructions, pyGPlates, python, tectonics},
doi = {https://doi.org/10.1002/gdj3.185},
url = {https://rmets.onlinelibrary.wiley.com/doi/abs/10.1002/gdj3.185},
eprint = {https://rmets.onlinelibrary.wiley.com/doi/pdf/10.1002/gdj3.185},
}-
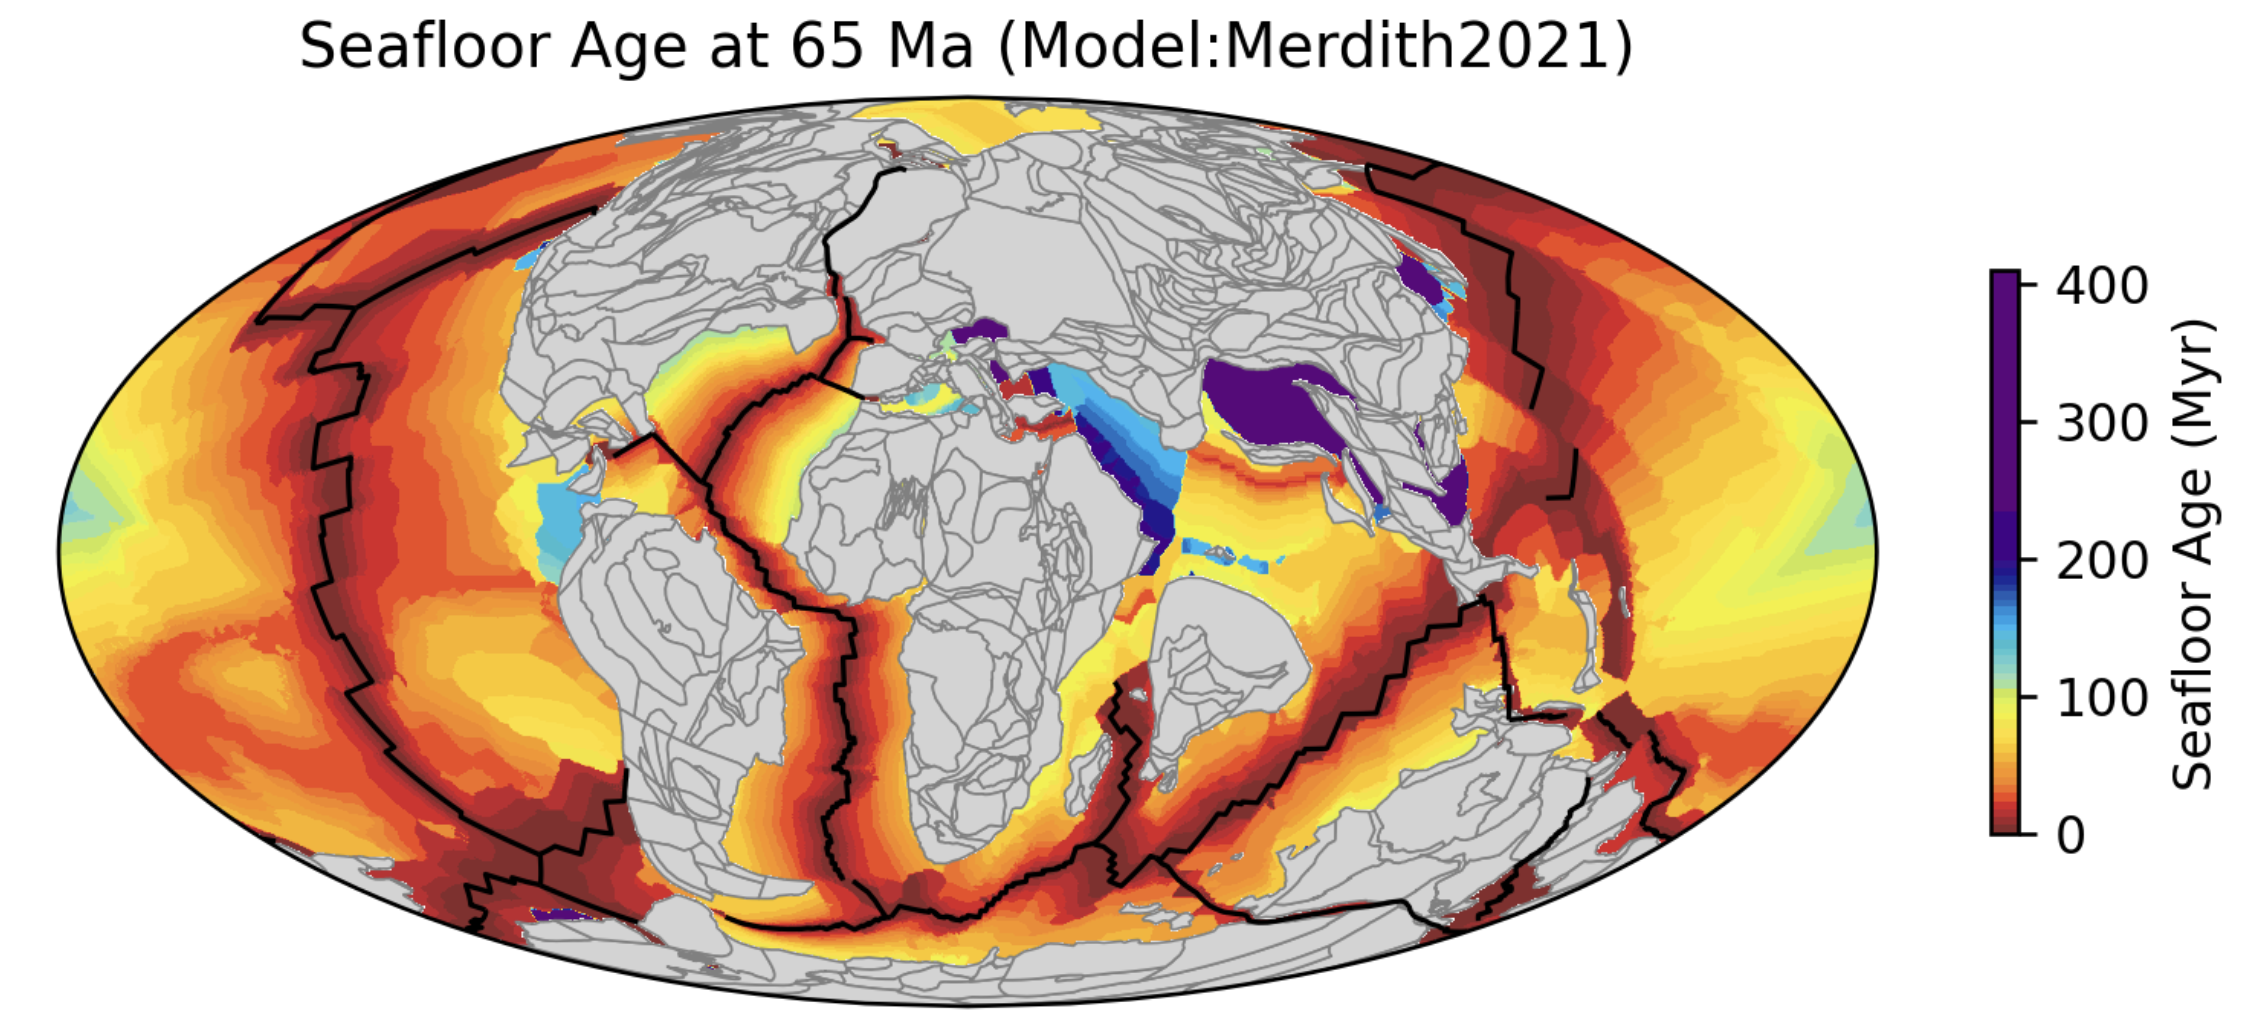
Generating Seafloor Age and Spreading Rate Grids Through Time
Adapted from code written by Simon Williams, Nicky Wright, and John Cannon for gridding general z-values onto seafloor basin points using GPlately.
Citation: Simon Williams, Nicky M. Wright, John Cannon, Nicolas Flament, R. Dietmar Müller, Reconstructing seafloor age distributions in lost ocean basins, Geoscience Frontiers, Volume 12, Issue 2,2021, Pages 769-780, ISSN 1674-9871, https://doi.org/10.1016/j.gsf.2020.06.004.
-
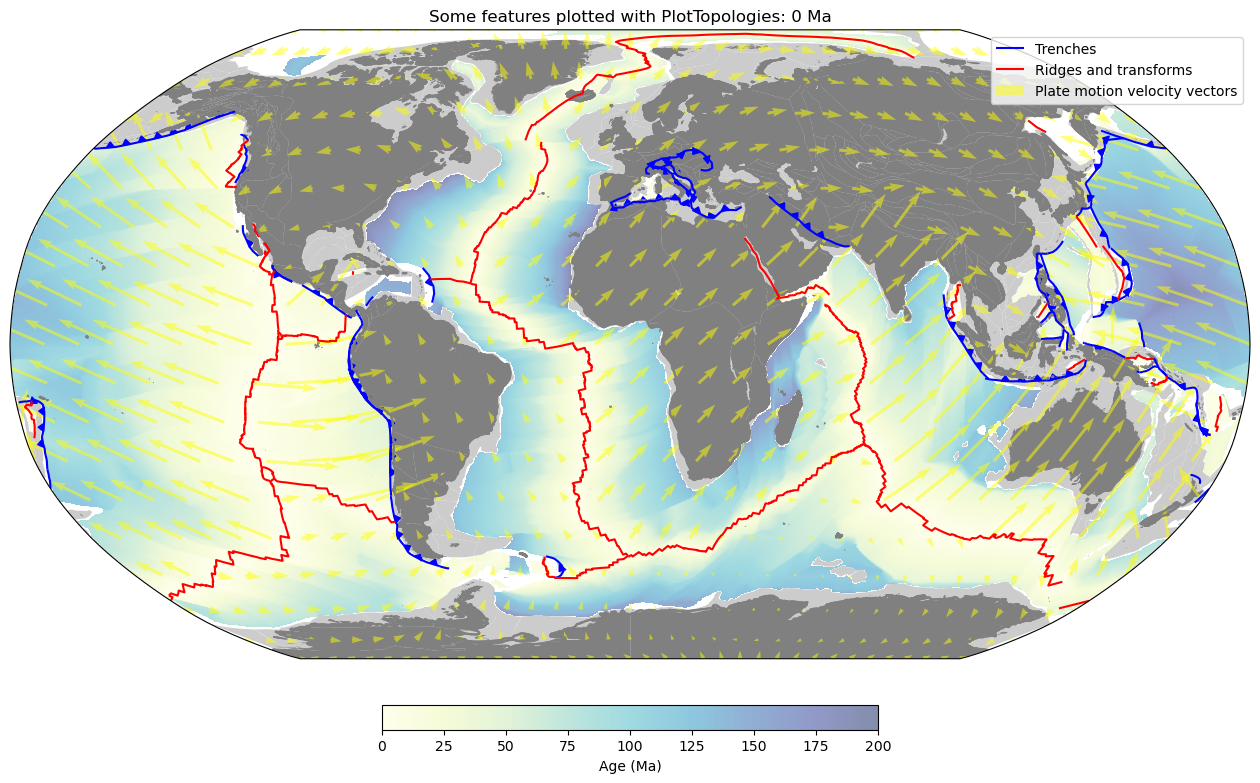
Plotting Paleomaps with Cartopy
GPlately can use Cartopy to plot paleomaps. The figure below shows a comparison of paleomaps produced with the Müller et al. 2019 and Müller et al. 2016 plate reconstruction models.
-
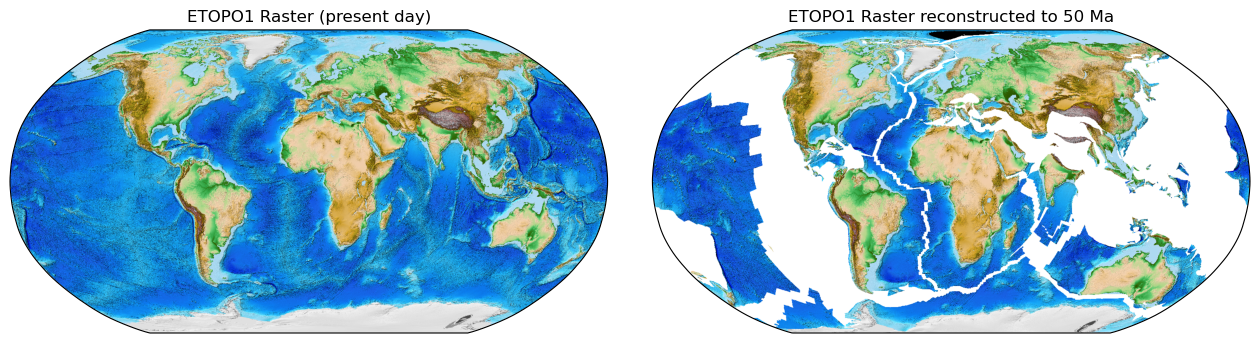
GPlately can be used to reconstruct raster datasets back through geological time. The figure below shows the ETOPO1 relief raster reconstructed to 50 Ma.
-
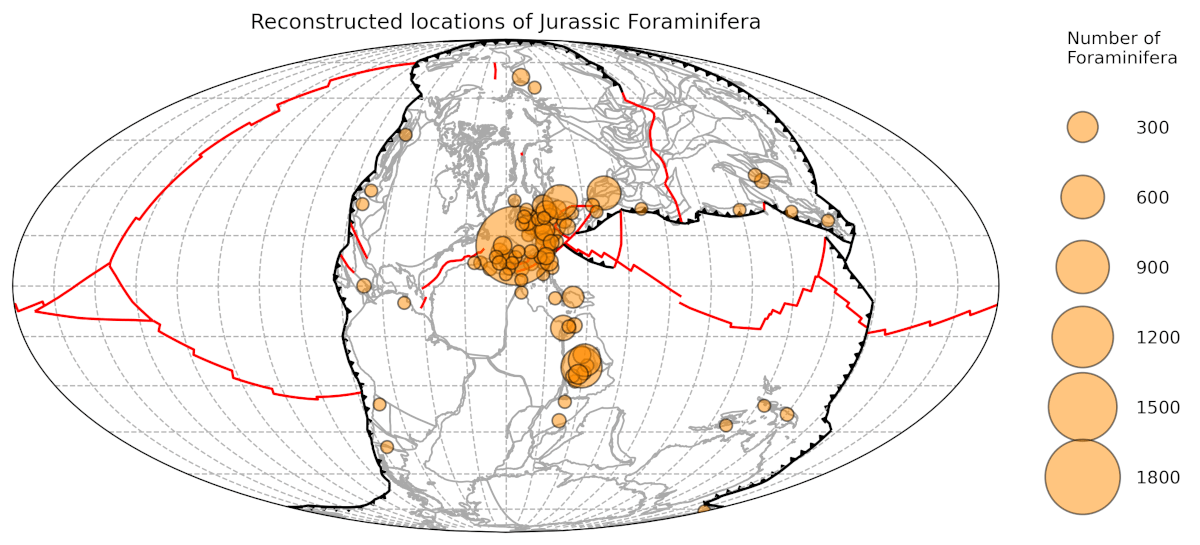
GPlately can be used to calculate the paleo-coordinates of locations. The figure below shows the reconstructed locations of Jurassic foraminifera.
-
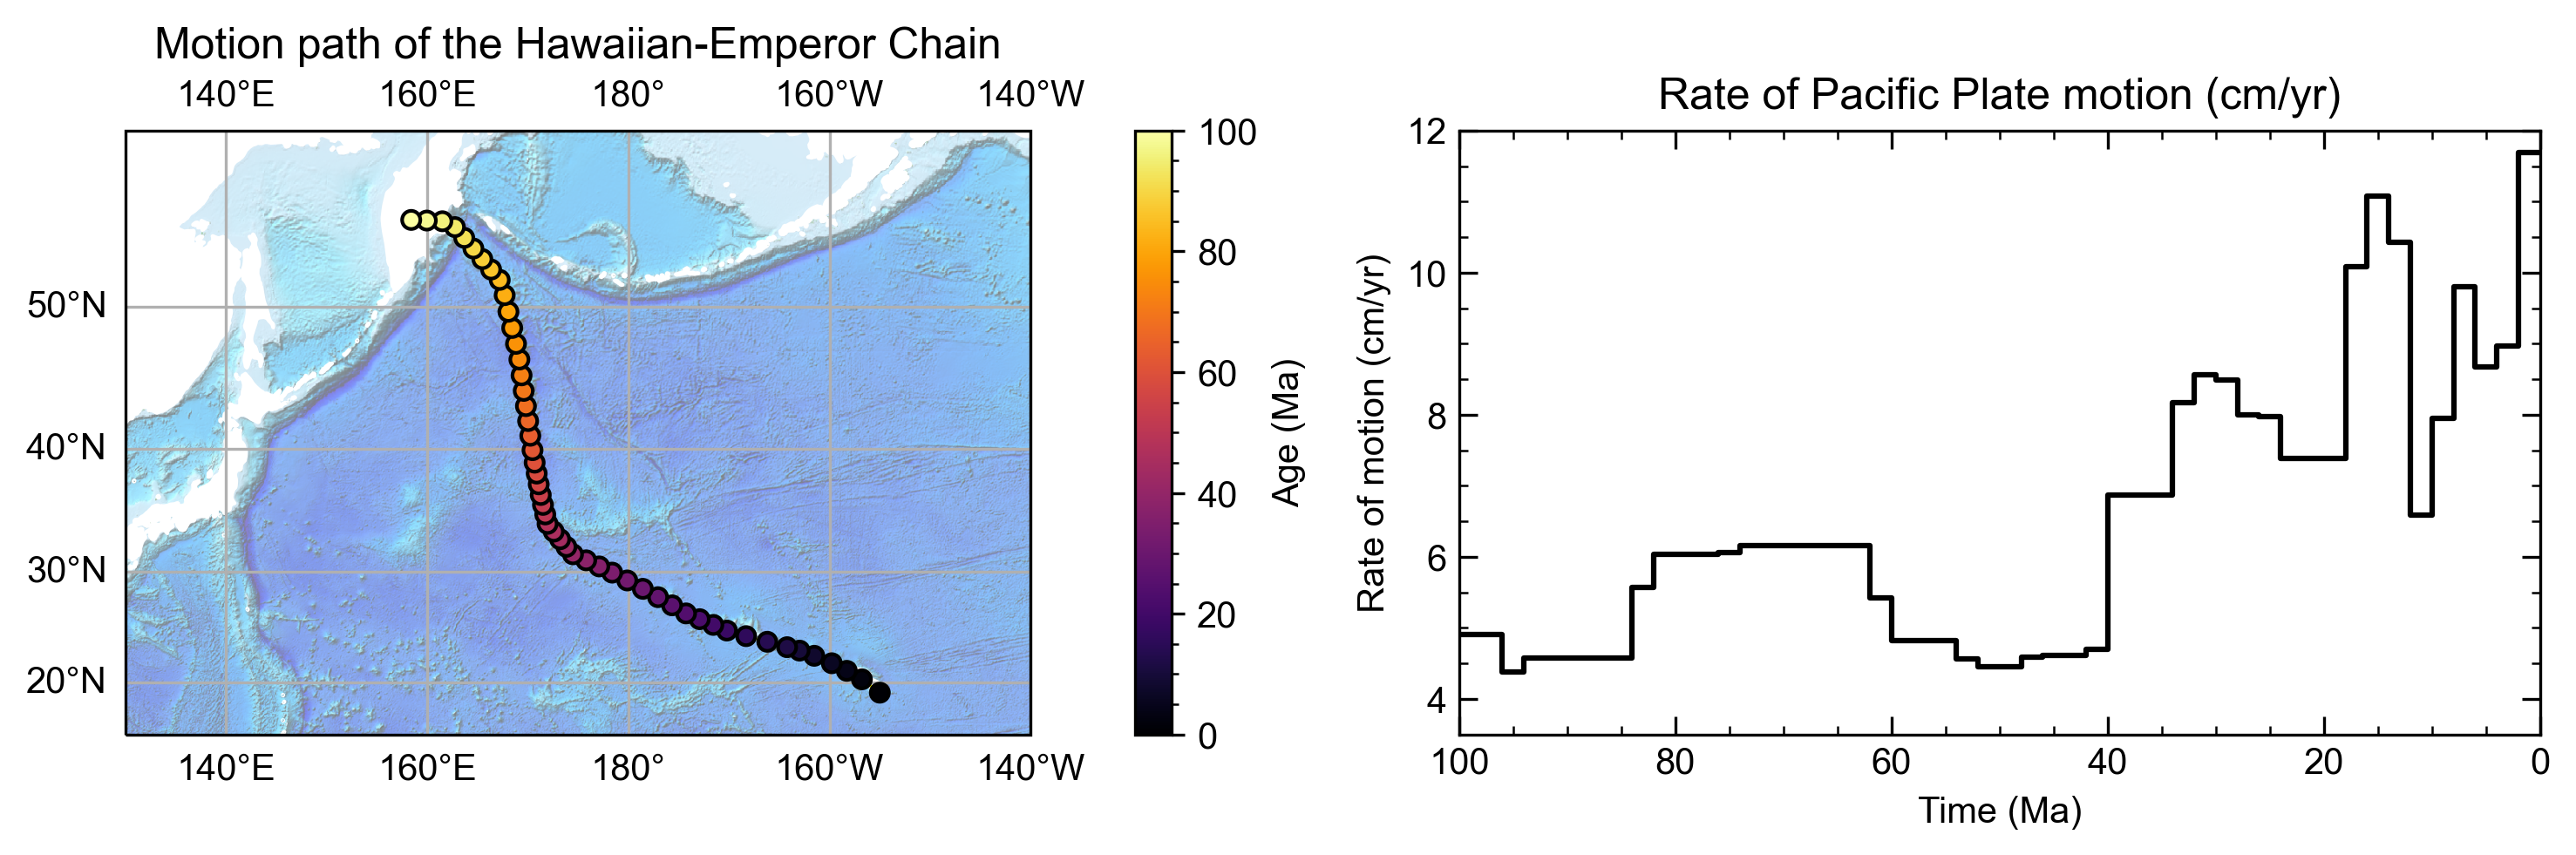
GPlately can generate motion paths to illustrate the trajectories of tectonic plates through geological time, and create flowlines to track plate motion from spreading features such as mid-ocean ridges.