This project presents a detailed time series analysis of selected stock price data using Python. The notebook explores temporal patterns, stationarity, decomposition, and smoothing techniques to uncover insights that support forecasting and investment decisions.
- Problem Statement: Understand and model the behavior of stock prices over time to identify trends, seasonality, and volatility.
- Objectives: Apply time series techniques to visualize, decompose, and smooth stock price data for actionable insights.
- Data Source: Historical stock price data retrieved from Yahoo Finance using
yfinance. - Context: Time series analysis is vital in financial modeling, risk management, and algorithmic trading. This project demonstrates intermediate-level techniques for exploring stock dynamics.
- Loading: Stock data is loaded and organized into a pivot table.
- Cleaning: Missing values are handled, and date formats are standardized.
- Validation: Data ranges and completeness are verified across all selected stocks.
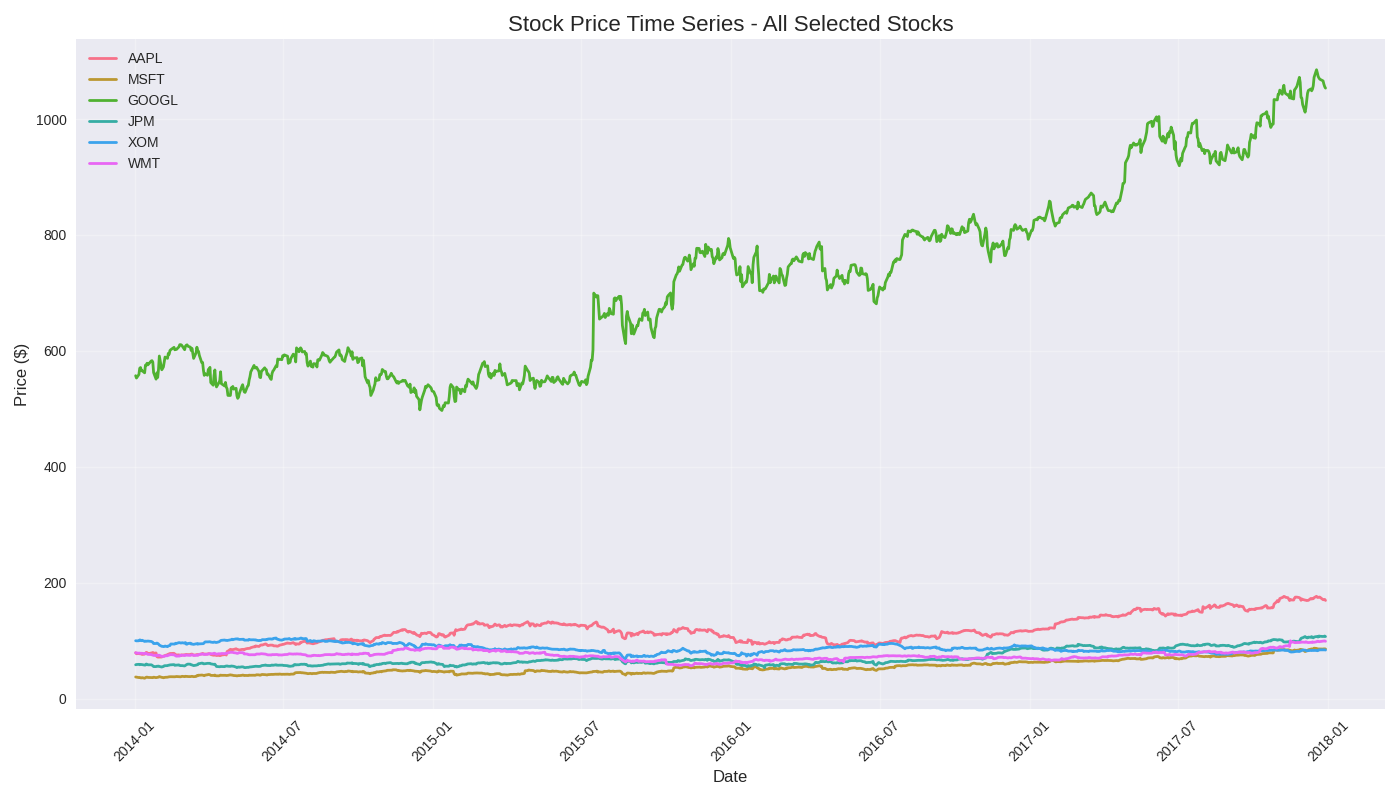
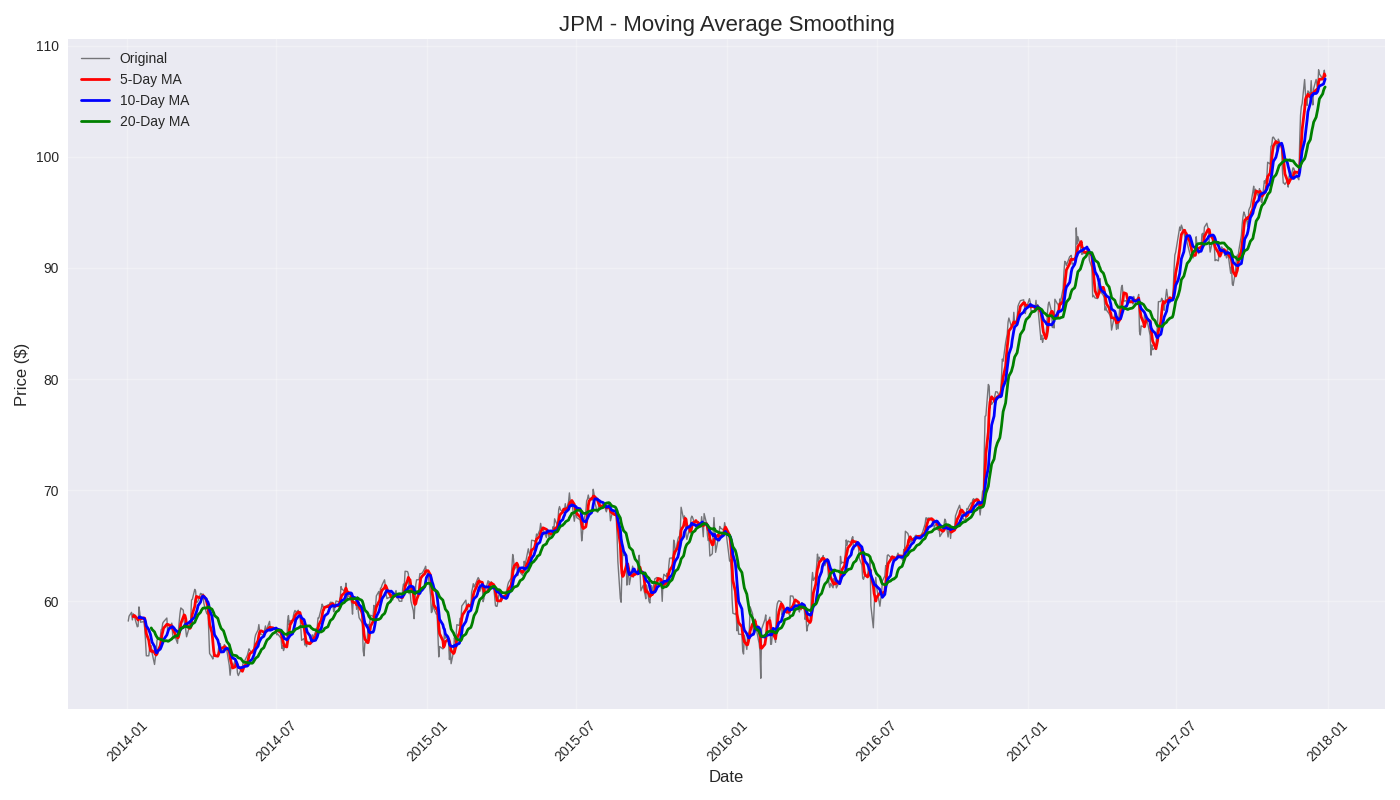
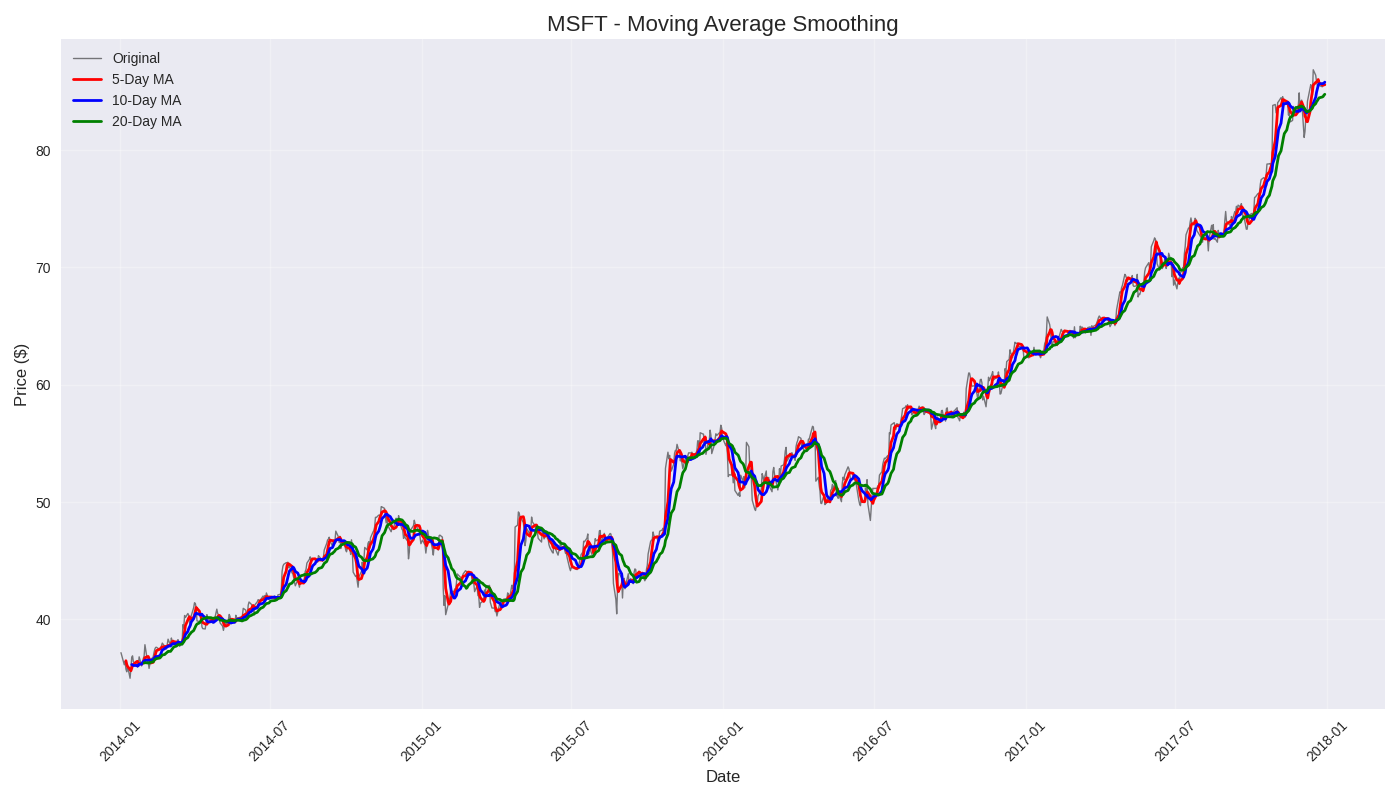
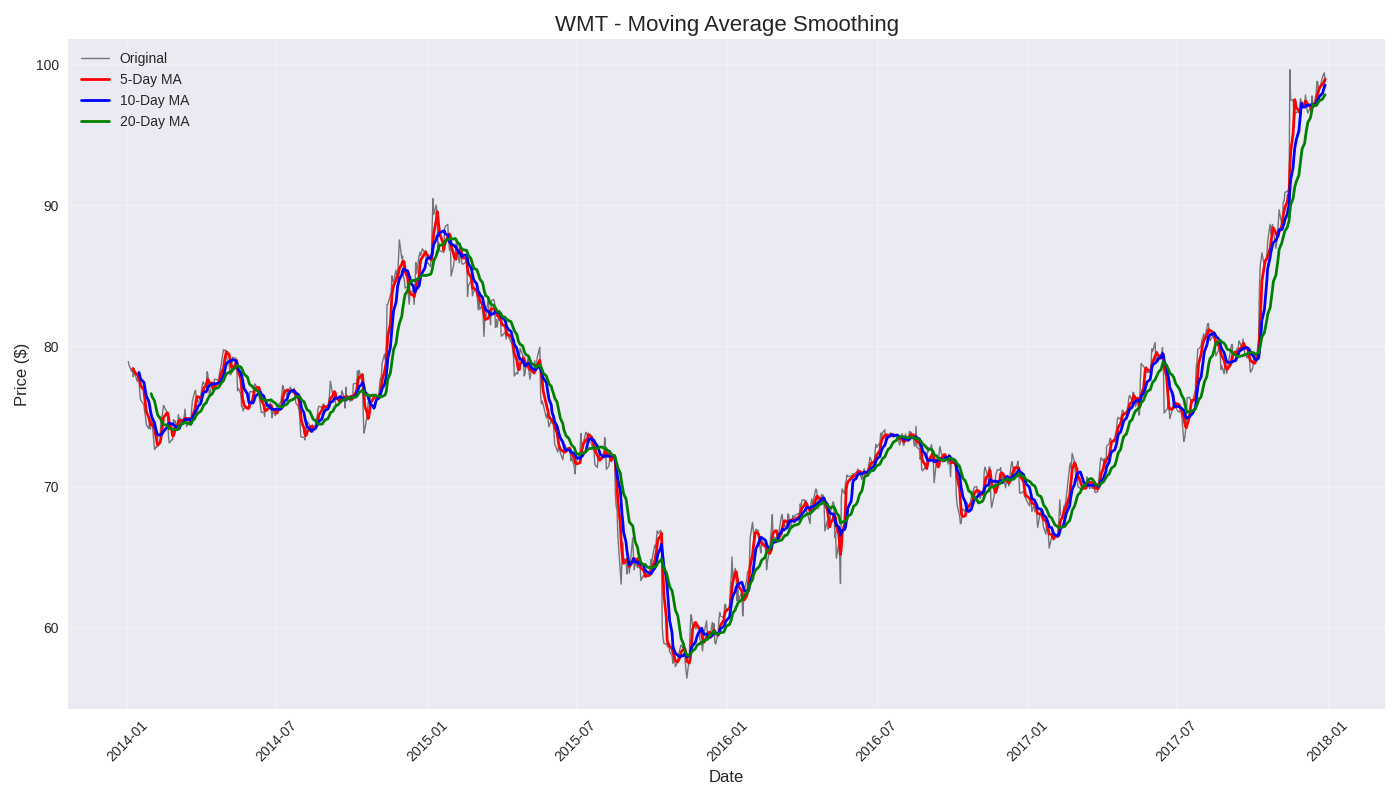
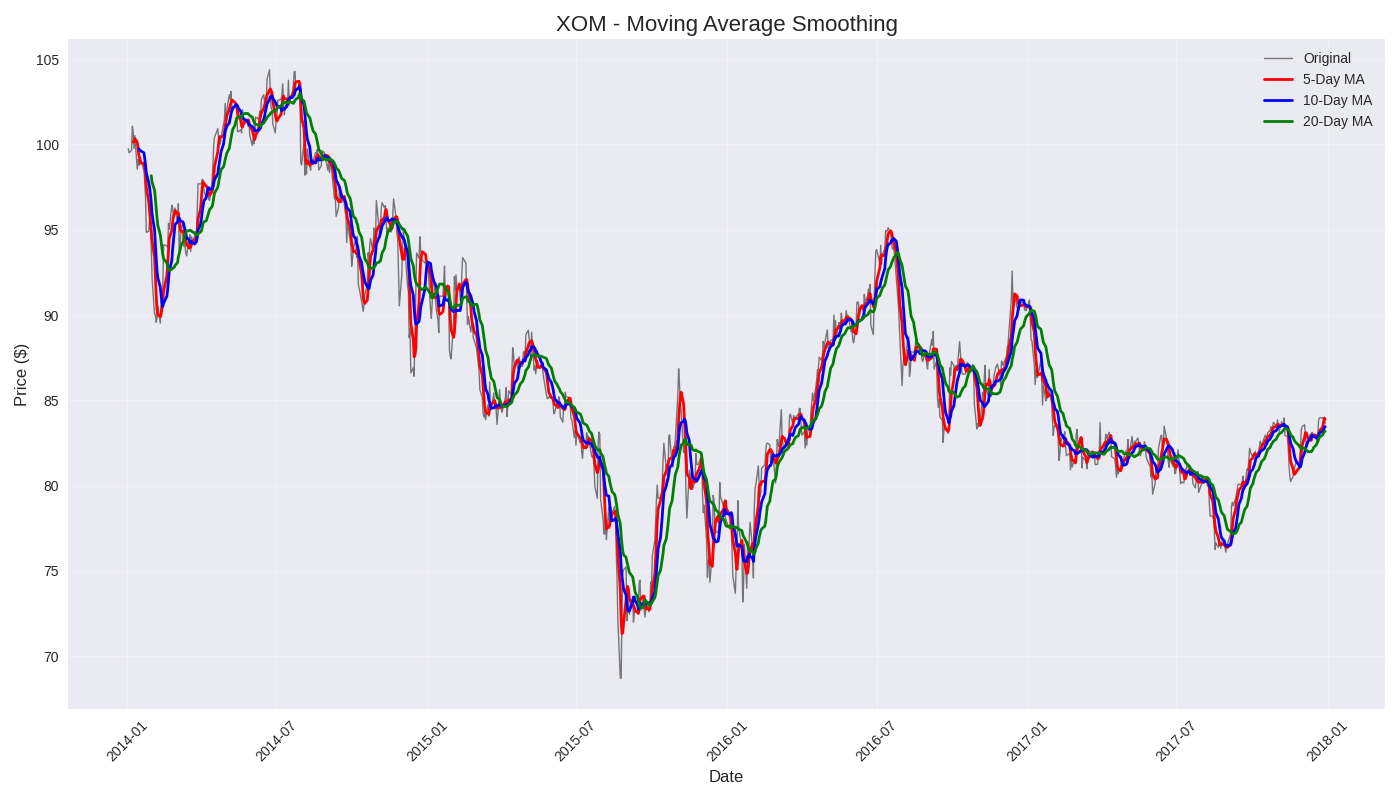
- Visualizations: Individual and comparative time series plots are generated for each stock.
- Statistics: Summary metrics such as mean, variance, and price range are computed.
- Patterns: Initial trends and cyclical behaviors are identified visually.
- ADF Test: Augmented Dickey-Fuller test is applied to assess stationarity.
- Visual Checks: Rolling mean and standard deviation plots are used to support statistical findings.
- Transformations: Log transformations or differencing are suggested if non-stationarity is detected.
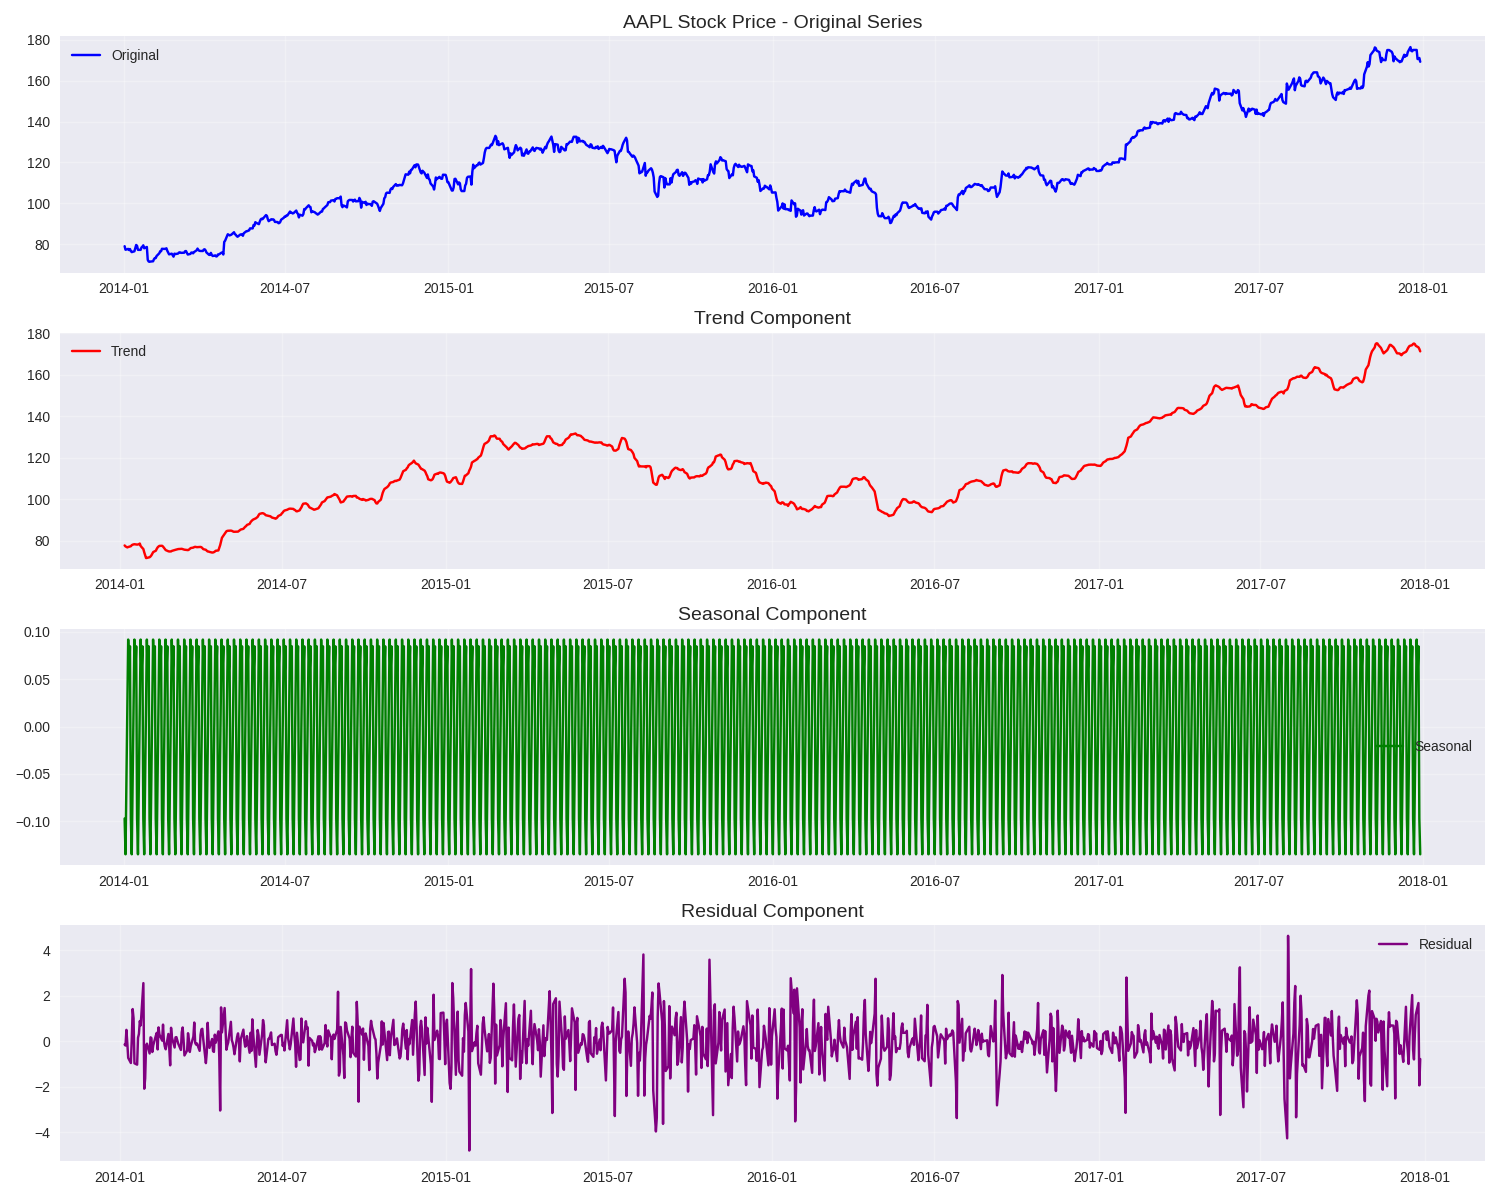
- Method:
seasonal_decomposefromstatsmodelsis used to split the series into:- Trend
- Seasonality
- Residuals
- Model Rationale: Additive decomposition is chosen based on data characteristics.
- Interpretation: Each component is analyzed to understand its contribution to overall price movement.
- Autocorrelation: ACF and PACF plots are used to study lag dependencies.
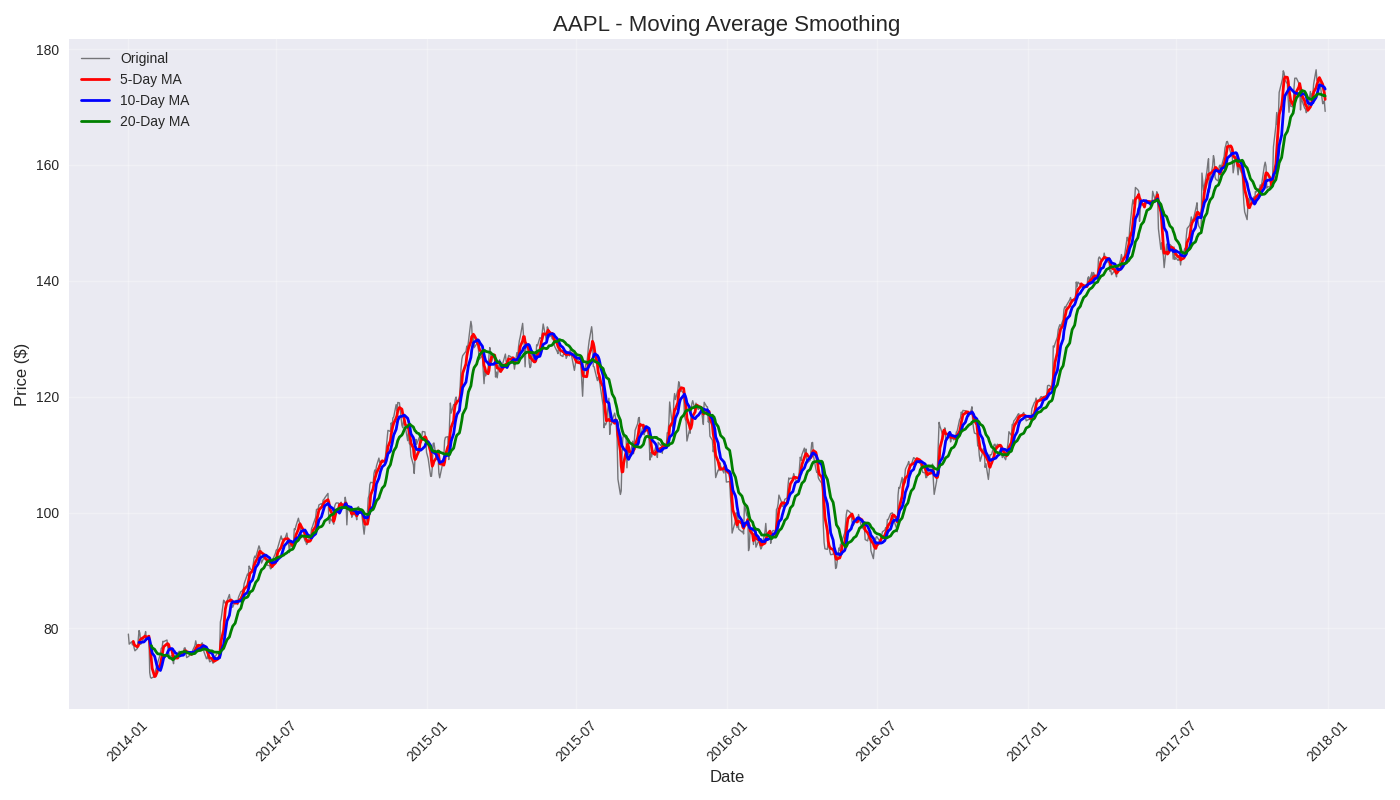
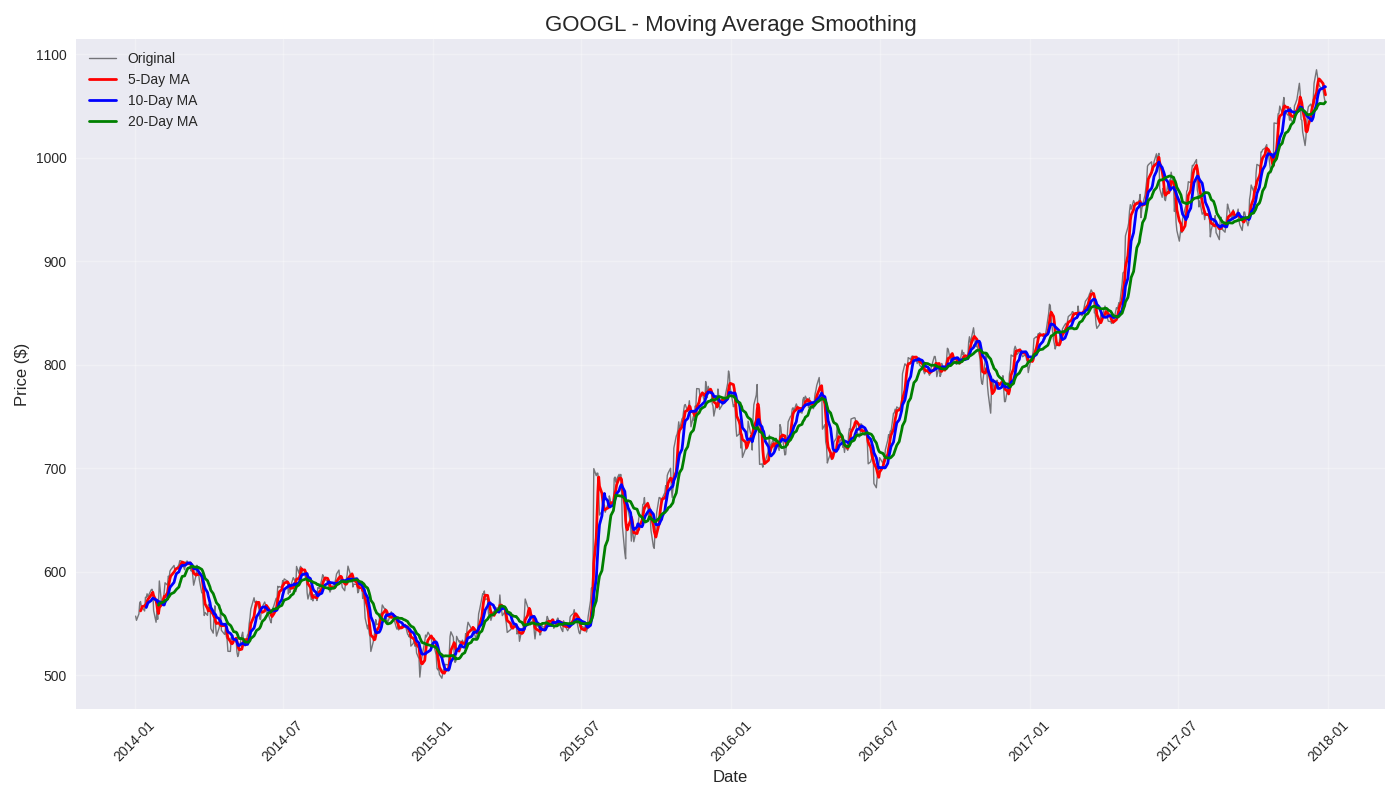
- Moving Average: 30-day smoothing is applied to highlight long-term trends.
- Seasonal Detection: Repeating patterns are examined across months and quarters.
- Investment Insights: Trend analysis supports timing decisions for entry and exit.
- Forecasting: Decomposition and stationarity checks lay the groundwork for ARIMA or Prophet models.
- Risk Management: Understanding volatility and residual noise helps assess uncertainty.
- Key Findings:
- Clear upward trends in selected stocks
- Seasonal dips and spikes aligned with market cycles
- Moderate residual noise indicating partial predictability
- Limitations:
- No forecasting model implemented yet
- Sentiment analysis not fully integrated
- Recommendations:
- Extend with ARIMA or Prophet for forecasting
- Integrate sentiment scores from news headlines or social media
- Build an interactive dashboard for stakeholder presentation
# Clone the repository
git clone https://github.com/Eric-Inkoom-Ayitey/Time-Series-Analysis.git
cd Time-Series-Analysis

# Install dependencies
pip install pandas matplotlib statsmodels yfinance

# Launch the notebook
jupyter notebook Time_Series_Analysis.ipynb