This document outlines the steps necessary to generate the figures for the manuscript Relating pupil diameter and blinking to cortical activity and hemodynamics across arousal states by K.L. Turner, K.W. Gheres, and P.J. Drew.
The code in this repository generates all main figures, supplemental information, and statistics. It contains the analysis code for all pre-processing steps as well as a demo code and examples for tracking pupil diameter.
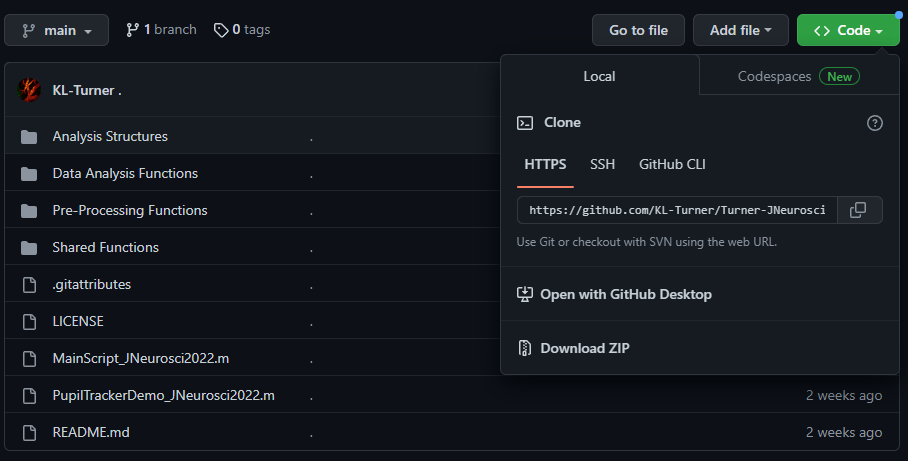
Begin by downloading the code repository by clicking the green Code button at the top of the page and selecting Download ZIP.
- Code repository location: https://github.com/KL-Turner/Turner-JNeurosci2022
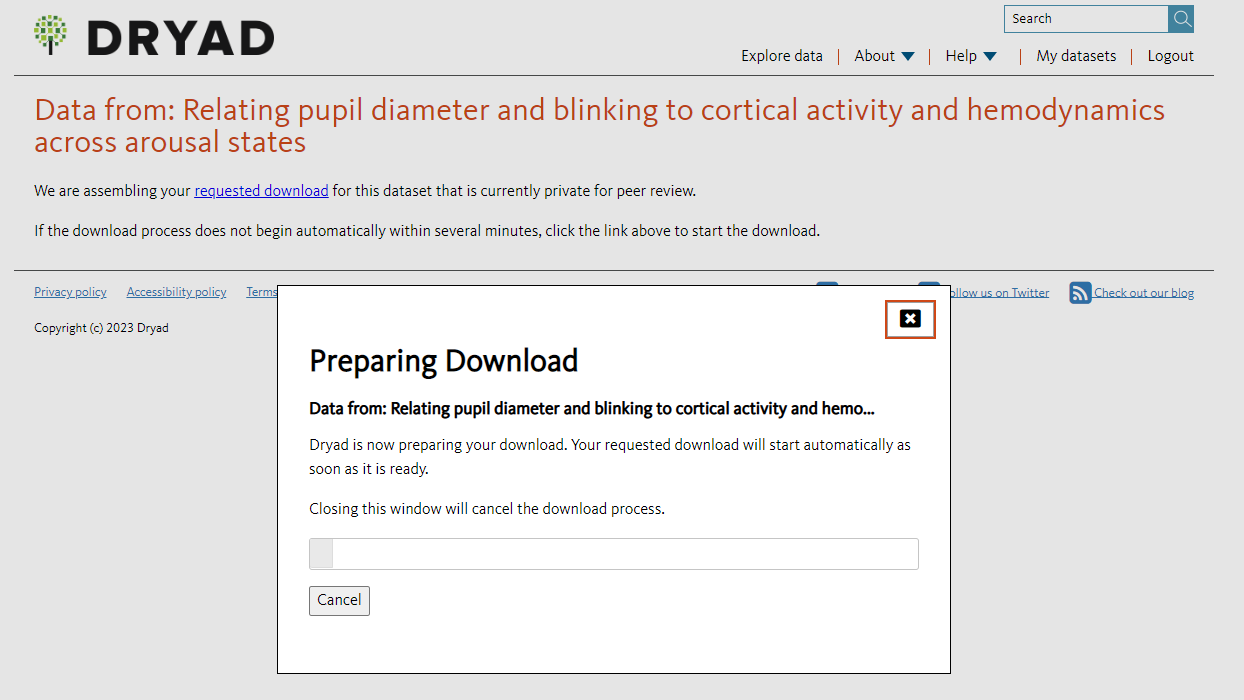
Next, the data (~4 GB) can be downloaded from the following location: https://datadryad.org/stash/share/pv4ZmJnSk65Y6yWxoO6jdb9ou5H-x5wfOJOTCPkBntE or searched under the DOI: doi:10.5061/dryad.05qfttf5w
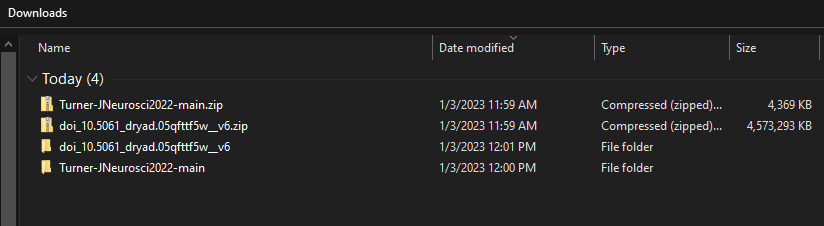
After downloading both the code and data, unzip both folders by right clicking and selecting Extract all. The unzipped folders should look something like this.
The Dryad link contains several pre-analyzed structures that can be used to immediately generate the figures without re-analyzing any data. To generate the figures, begin by moving all of the files from the unzipped Dryad folder into the Analysis Structures folder located in the code repository.
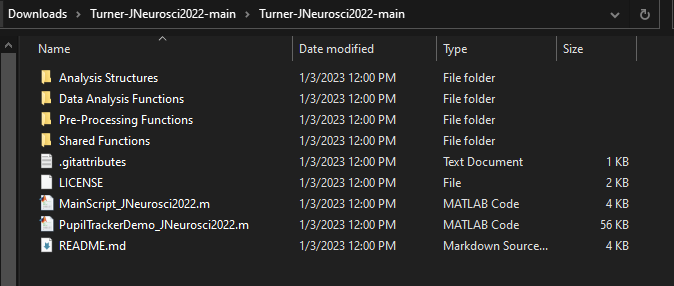
The data should be here.
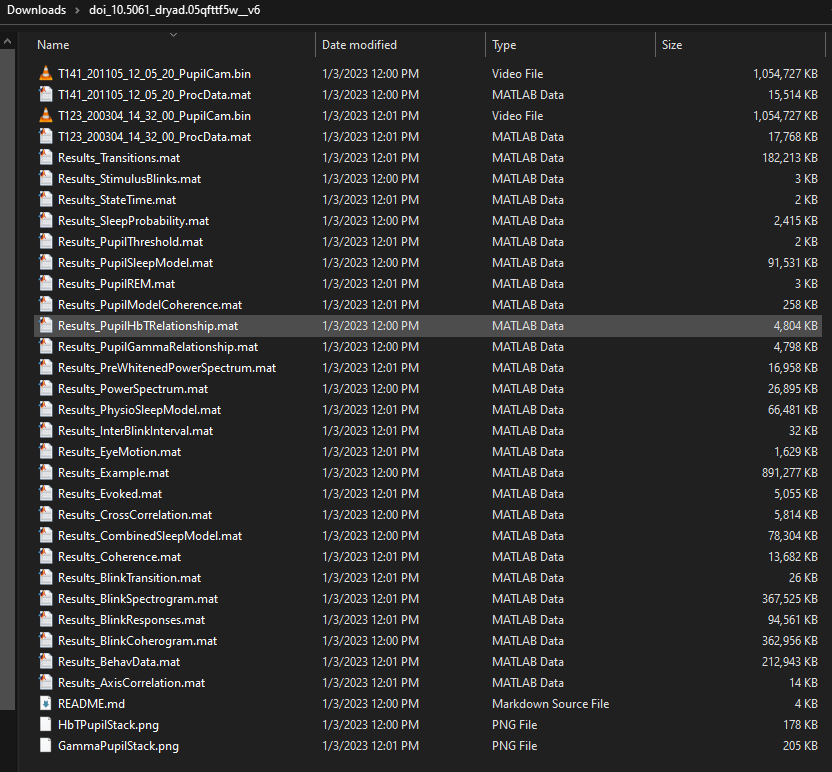
The repository includes pre-analyzed structures for each analysis performed in the paper, each of these has the prefix "Results_" followed by the analysis performed. There are two images with histogram overlays that are saved to be display in figure panels. Finally, there are two examples provided (T123, T141) which includes the binary file for a demo of pupil tracking as well as the accompanying data for all other signals during that 15 minute acquisition.
The contents of the data includes the following:
- Results_AxisCorrelation.mat - comparison of major/minor axis of pupil during measurement, in text
- Results_BehavData.mat - comparison of pupil size between different arousal states, Fig. 2
- Results_BlinkCoherogram.mat - comparison of neural/hemodynamic coherence before/after a blink, Fig. 5
- Results_BlinkResponses.mat - comparison of EMG, neural activity, and hemodynamics before/after blinking, Fig. 4
- Results_BlinkSpectrogram.mat - comparison of neural/hemodynamic power before/after a blink, Fig. 5
- Results_BlinkTransition.mat - probability of each arousal state surrounding a blink, Fig. 4
- Results_Coherence.mat - coherence between pupil diameter and hemodynamics or neural activity, Fig. 3
- Results_CombinedSleepModel.mat - sleep model based on eye characteristics, Fig. 7
- Results_CrossCorrelation.mat - cross correlation between pupil diameter and hemodynamics or neural activity, Fig. 3
- Results_Evoked.mat - whisking/stimulus/auditory evoked changes in pupil diameter, Fig. 2
- Results_Example.mat - example figure (T141), Fig. 1
- Results_EyeMotion.mat - analysis of eye motion for detection of REM sleep, Fig. 6
- Results_InterBlinkInterval.mat - time between each successive blink, Fig. 4
- Results_PhysioSleepModel.mat - sleep model based on ephys and behavior data not including eye, Fig. 7
- Results_PowerSpectrum.mat, power spectrum calculations
- Results_PreWhitenedPowerSpectrum.mat, power spectra calculations for pupil diameter, Fig. 2
- Results_PupilGammaRelationship.mat, GammaPupilStack.png - pupil size vs. neural gamma, Fig. 3
- Results_PupilHbTRelationship.mat, HbTPupilStack.png - pupil size vs. hemodynamics, Fig. 3
- Results_PupilREM.mat - comparison on REM sleep with eyes open/closed, in text
- Results_PupilSleepModel.mat - sleep model based on eye characteristics, Fig. 7
- Results_PupilThreshold.mat - typical distribution of pupil intensity for thresholding in Radon space, in text
- Results_SleepProbability.mat - probability of being in arousal state as a function of pupil size, Fig. 6
- Results_StateTime.mat - duration spent in each arousal state, in text
- Results_StimulusBlinks.mat - probability of blinking following whisker stimuli, Fig. 4
- Results_Transitions.mat - arousal transitions for pupil diameter/eye motion, Fig. 6
In addition to the data structures, there are example files meant to be run with PupilTrackerDemo_JNeurosci2022.m. There are two animals (T141 and T123) with pre-analyzed MATLAB data structures including all the relevant information (ProcData.mat), as well as the raw binary file of the pupil camera video (PupilCam.bin).
- T141_201105_12_05_20_PupilCam.bin - Fig. 1 example, raw eye data
- T141_201105_12_05_20_ProcData.mat - Fig. 1 example, processed data
- T123_200304_14_32_00_PupilCam.bin - Turner eLife 2020 Fig. 1 example, raw eye data
- T123_200304_14_32_00_ProcData.mat - Turner eLife 2020 Fig. 1 example, processed data
From here, open MATLAB and nativate to the code's folder. Open the function MainScript_JNeurosci2022.m. The final view should look like this:
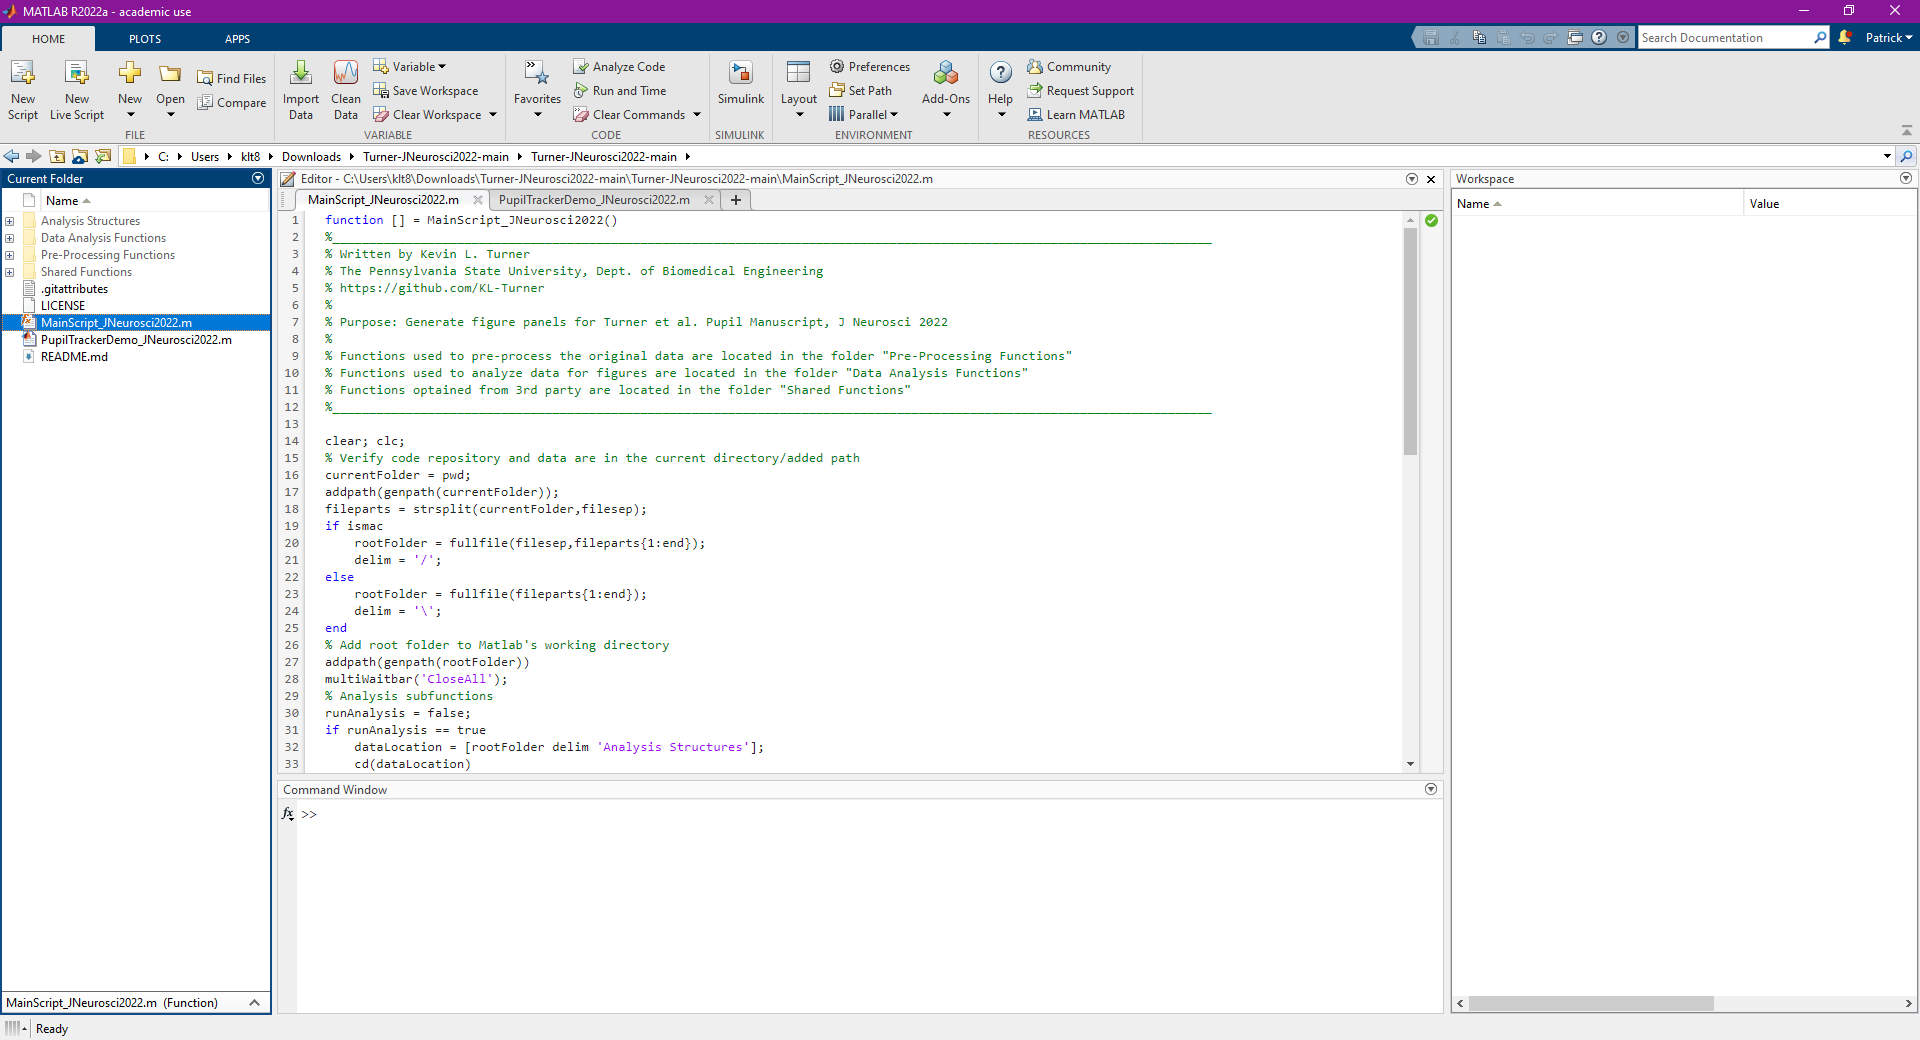
Finally, Click the green Run button and the figures will then take a few minutes to generate.
Software/System Requirements: Code was written and tested with MATLAB 2019b-2022a. Running MainScript_JNeurosci2022.m took < 5 minutes to run on a 2021 Macbook Pro with M1 Pro chipset and 16 Gb RAM.
If you would like to automatically save the MATLAB figures and statistical read-outs, change line 62 of MainScript_JNeurosci2022.m to saveFigs = true; This will slightly increase the analysis time and create a new folder /Summary Figures and Structures/MATLAB Analysis Figures/. All statistical readouts and saved MATLAB figures can be found here.
LabVIEW code used to acquire the data can be found at: https://github.com/DrewLab/LabVIEW-DAQ
- multiWaitbar.m Author: Ben Tordoff https://www.mathworks.com/matlabcentral/fileexchange/26589-multiwaitbar-label-varargin
- colors.m Author: John Kitchin http://matlab.cheme.cmu.edu/cmu-matlab-package.html
- Chronux subfunctions http://chronux.org/
- Several functions utilize code written by Dr. Patrick J. Drew, Dr. Kyle W. Gheres, and Dr. Aaron T. Winder https://github.com/DrewLab