Home
Project that records the temperature of a grill using a Thermistor and graphs the readings into a Raspberry Pi server.
An ESP32 is connected to a Raspberry Pi to read a thermistor. The Raspberry Pi then hosts a Nodejs server to request data from the ESP32 and displays the graph using a Reactjs frontend.

The ESP32 used is a TTGO LoRa SX1276 OLED board. The Raspberry Pi does not have an ADC that could be used to read from an analogue signal so this ESP32 is used to do so, as well as an immediate temperature reading using a display.
The ESP32 periodically reads the analog signal, converts the signal into temperature reading in Celsius and stores the data. The Raspberry Pi is connected to the ESP32 using SPI and acts as a master to the slave(ESP32).
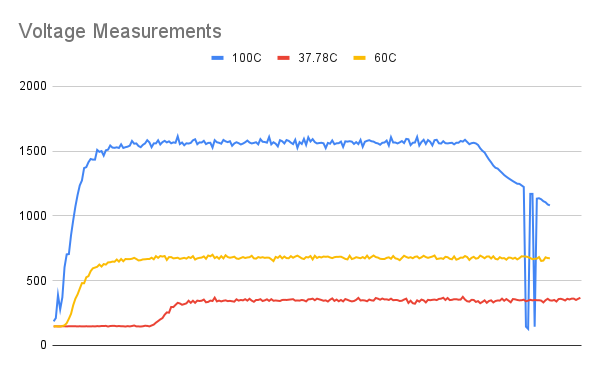
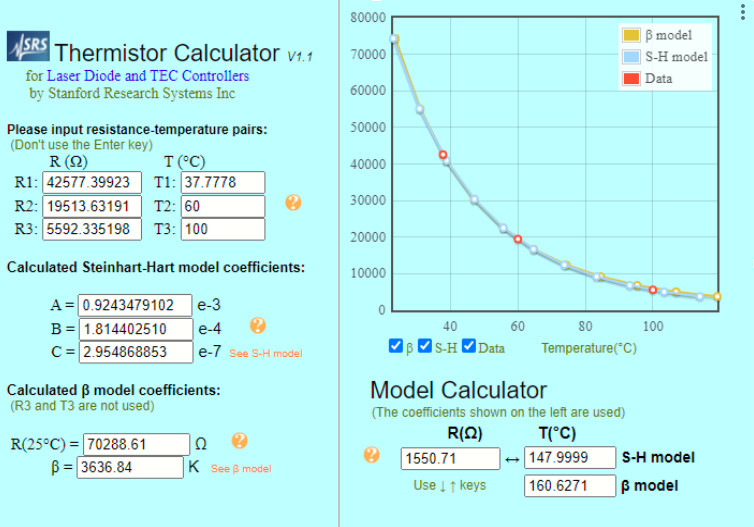
The thermistor used was a ThermoPro probe with a 2.5mm jack. There was no data sheet that could be found to be able to accurately read from this thermistor. Using a thermal immersion circulation to heat water to control water temperature, the thermistor was used to measure the voltage at 3 temperature points. Then the Steinhart-Hart equation was used to model the voltage to a temperature.
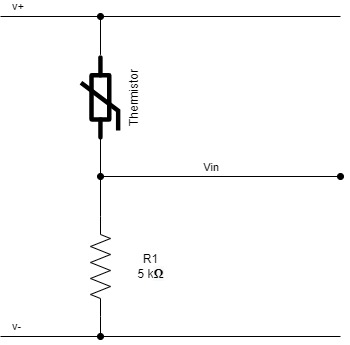
The analog reading given is only a voltage. The voltage must then be converted to a resistance using voltage divider:
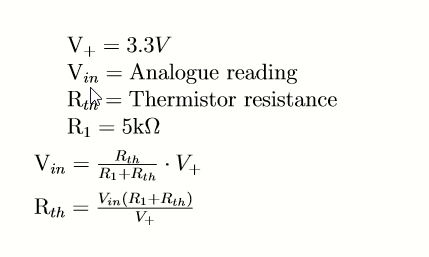
From the resistance of the Thermistor at different temperature points, we can then model its behavior using the Steinhart-hart equation
The Raspberry Pi serves as the server that connects to the Wi-Fi network locally and hosts a NodeJs server that upon connection with a browser serves a web Application. The web application then plots the temperature point on a graph across time.