![]()

🌐 A modern Angular-based web interface for the Message Broker, providing real-time monitoring, log viewing, and system metrics visualization. Built with Angular Material for a clean, responsive user experience.
- Features
- Pages Overview
- Prerequisites
- Installation
- Development
- Building
- Testing
- Architecture
- Contributing
-
🎨 Advanced WebSocket Communication:
- Real-time bidirectional communication with automatic reconnection
- Connection state management (Connected, Connecting, Reconnecting, Disconnected)
- Heartbeat monitoring with latency tracking
- Comprehensive connection event history
- Request/Response pattern support with UUIDs
- Automatic service registration
- Advanced error handling and recovery
-
📊 System Metrics and Analytics:
- Real-time performance metrics visualization using Chart.js
- CPU and Memory usage tracking (both system and process)
- Historical metrics tracking (5-minute buffer)
- Multiple metric types (gauge, rate, uptime, percent)
- Smart metric value formatting
- Service-specific metrics tracking
- Automatic metric updates with configurable polling
- Responsive and interactive charts with tooltips
-
🔍 Service Management:
- Real-time service discovery and monitoring
- Service status tracking (connected/disconnected)
- Service metadata and description management
- Subscription tracking per service
- Service-specific metrics visualization
- Historical disconnected service tracking
- Automatic cleanup of stale services
-
📨 Topic Management:
- Real-time topic subscription tracking
- Subscriber count and details
- Priority-based subscription management
- Last update tracking per topic
- Automatic topic cleanup
- Topic filtering and search
-
📝 Advanced Logging System:
- Multiple log levels (DEBUG, INFO, WARN, ERROR)
- Structured log entries with metadata
- Module-based logging
- Real-time log streaming
- Log filtering and search
-
🎨 Comprehensive Theme System:
- Light/Dark mode with system preference detection
- 12 Material Design color palettes
- Persistent theme preferences
- Real-time theme switching
-
📱 Modern UI/UX:
- Responsive Material Design
- Virtual scrolling for performance
- Advanced filtering and sorting
- Expandable detailed views
- Real-time updates
- Connection status indicators
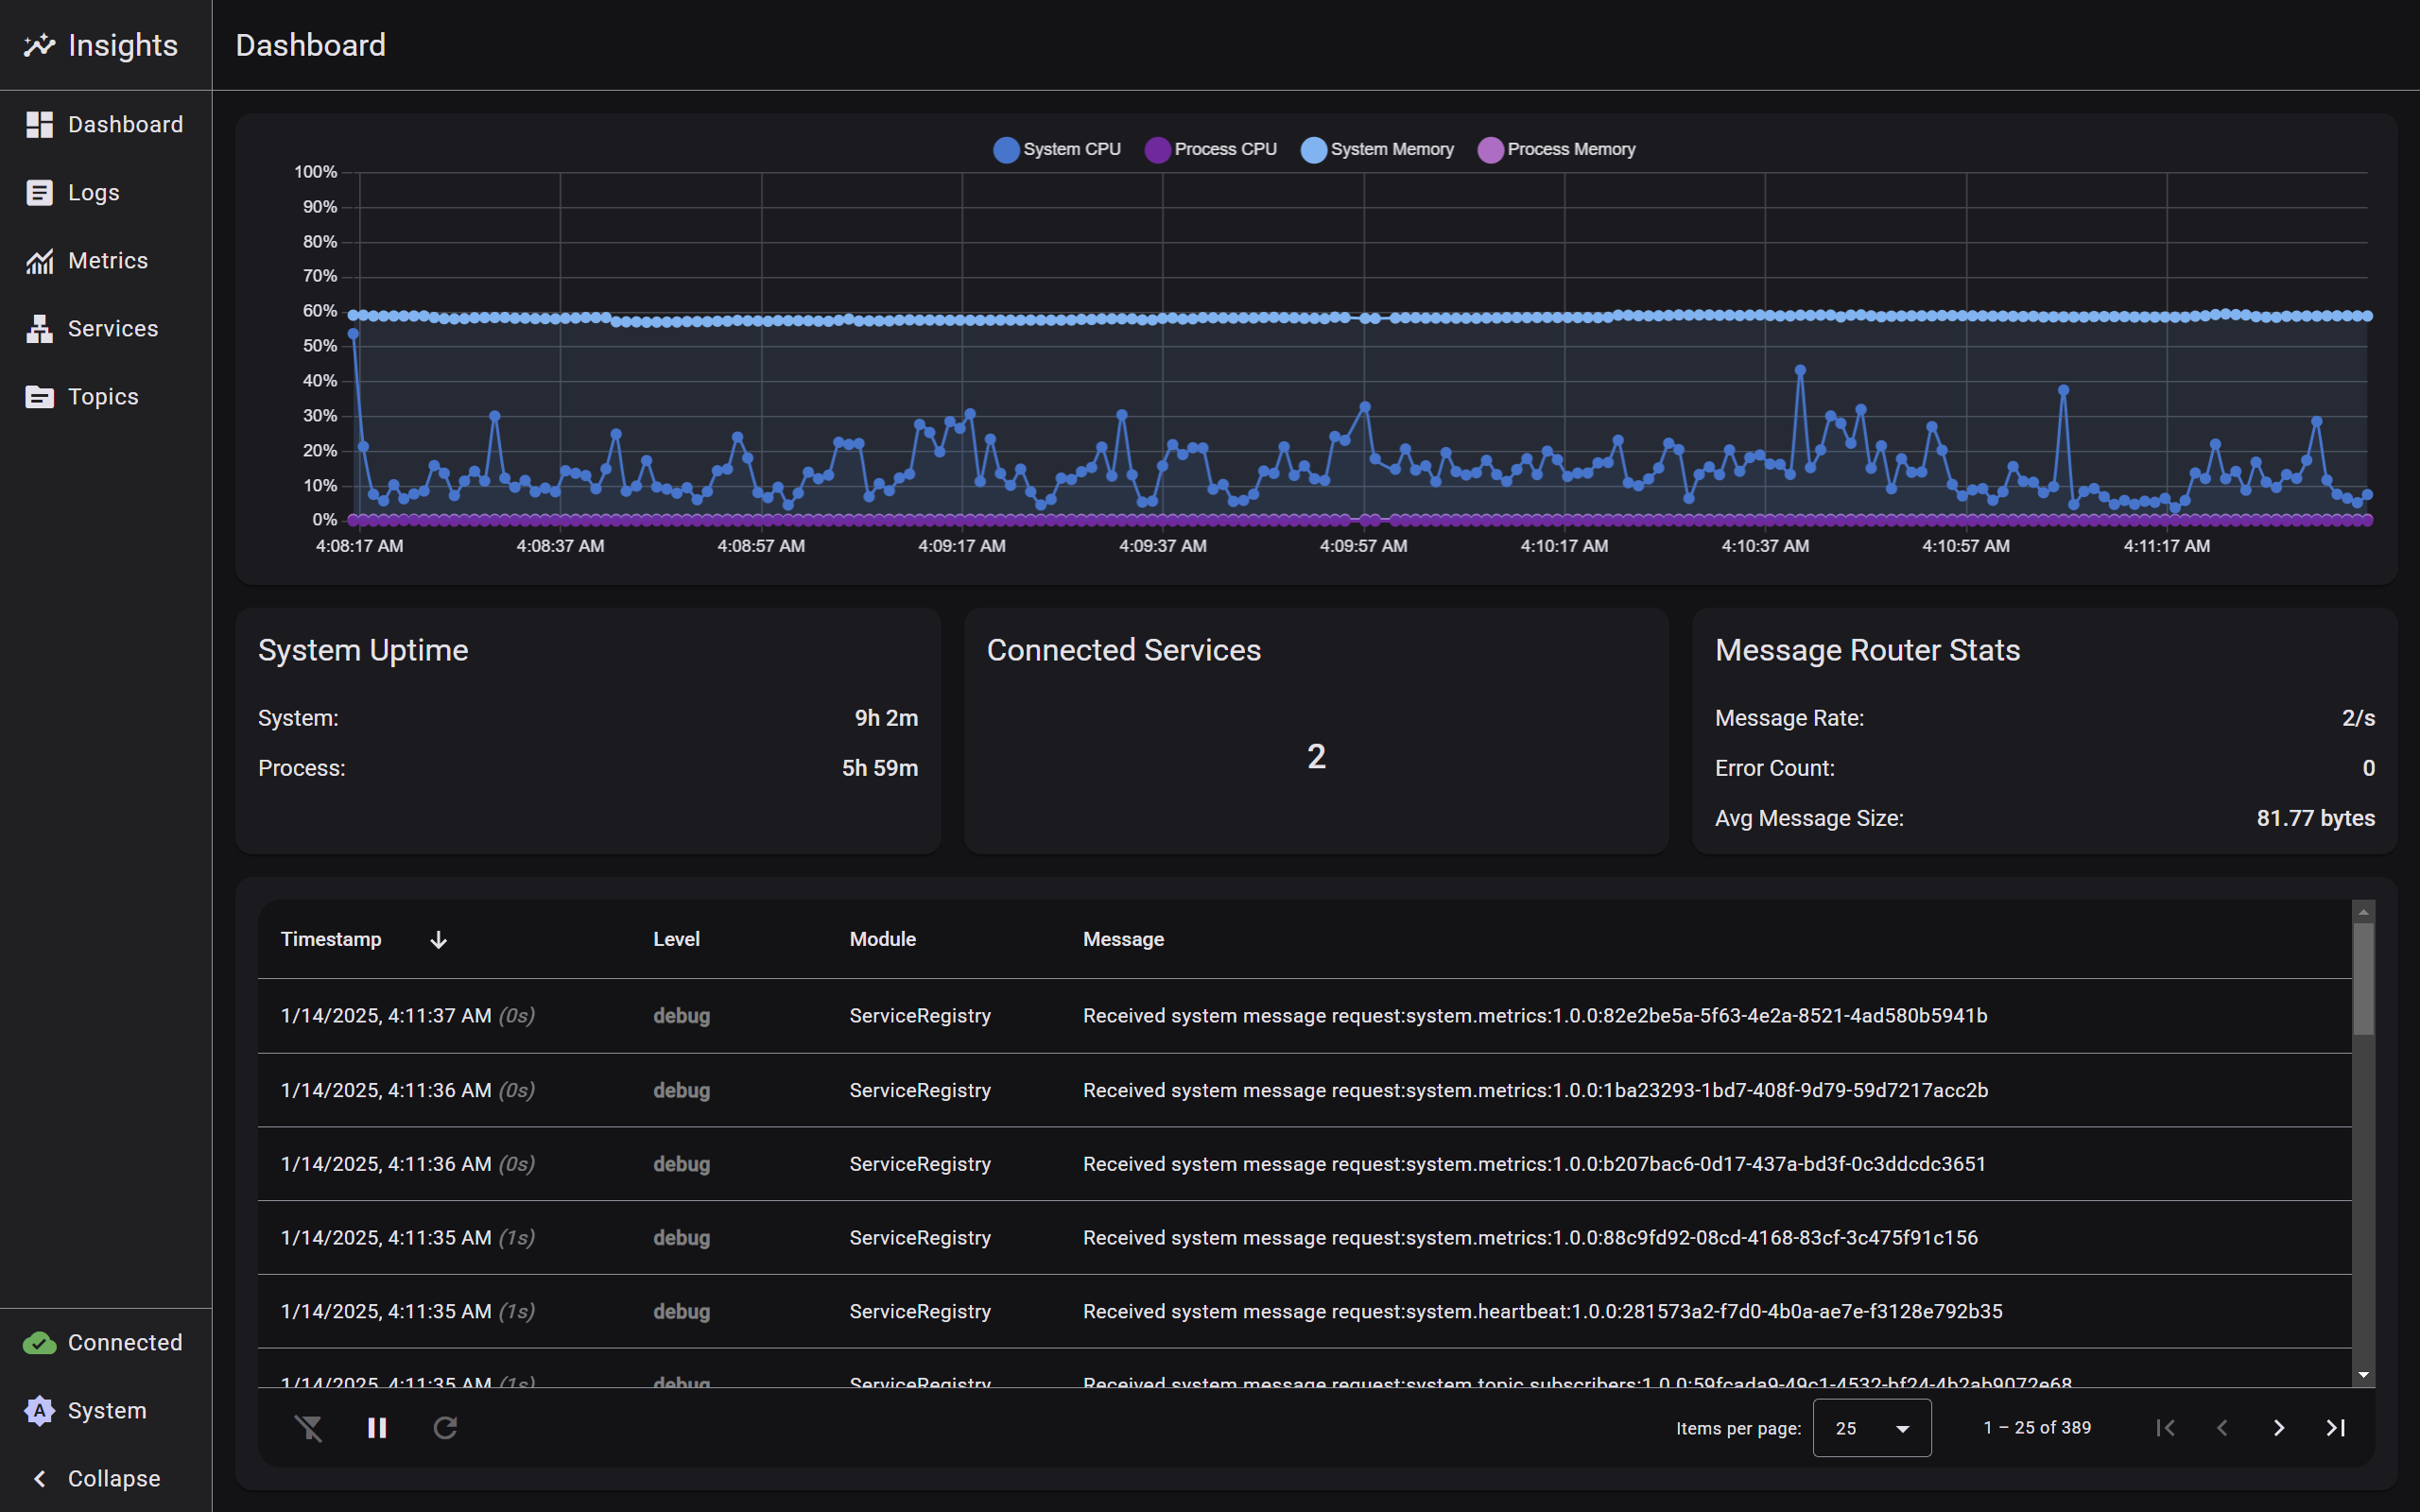
- Main landing page providing a high-level system overview
- Real-time connection status and metrics visualization
- Quick access to critical system information
- Service health indicators and active topic counts
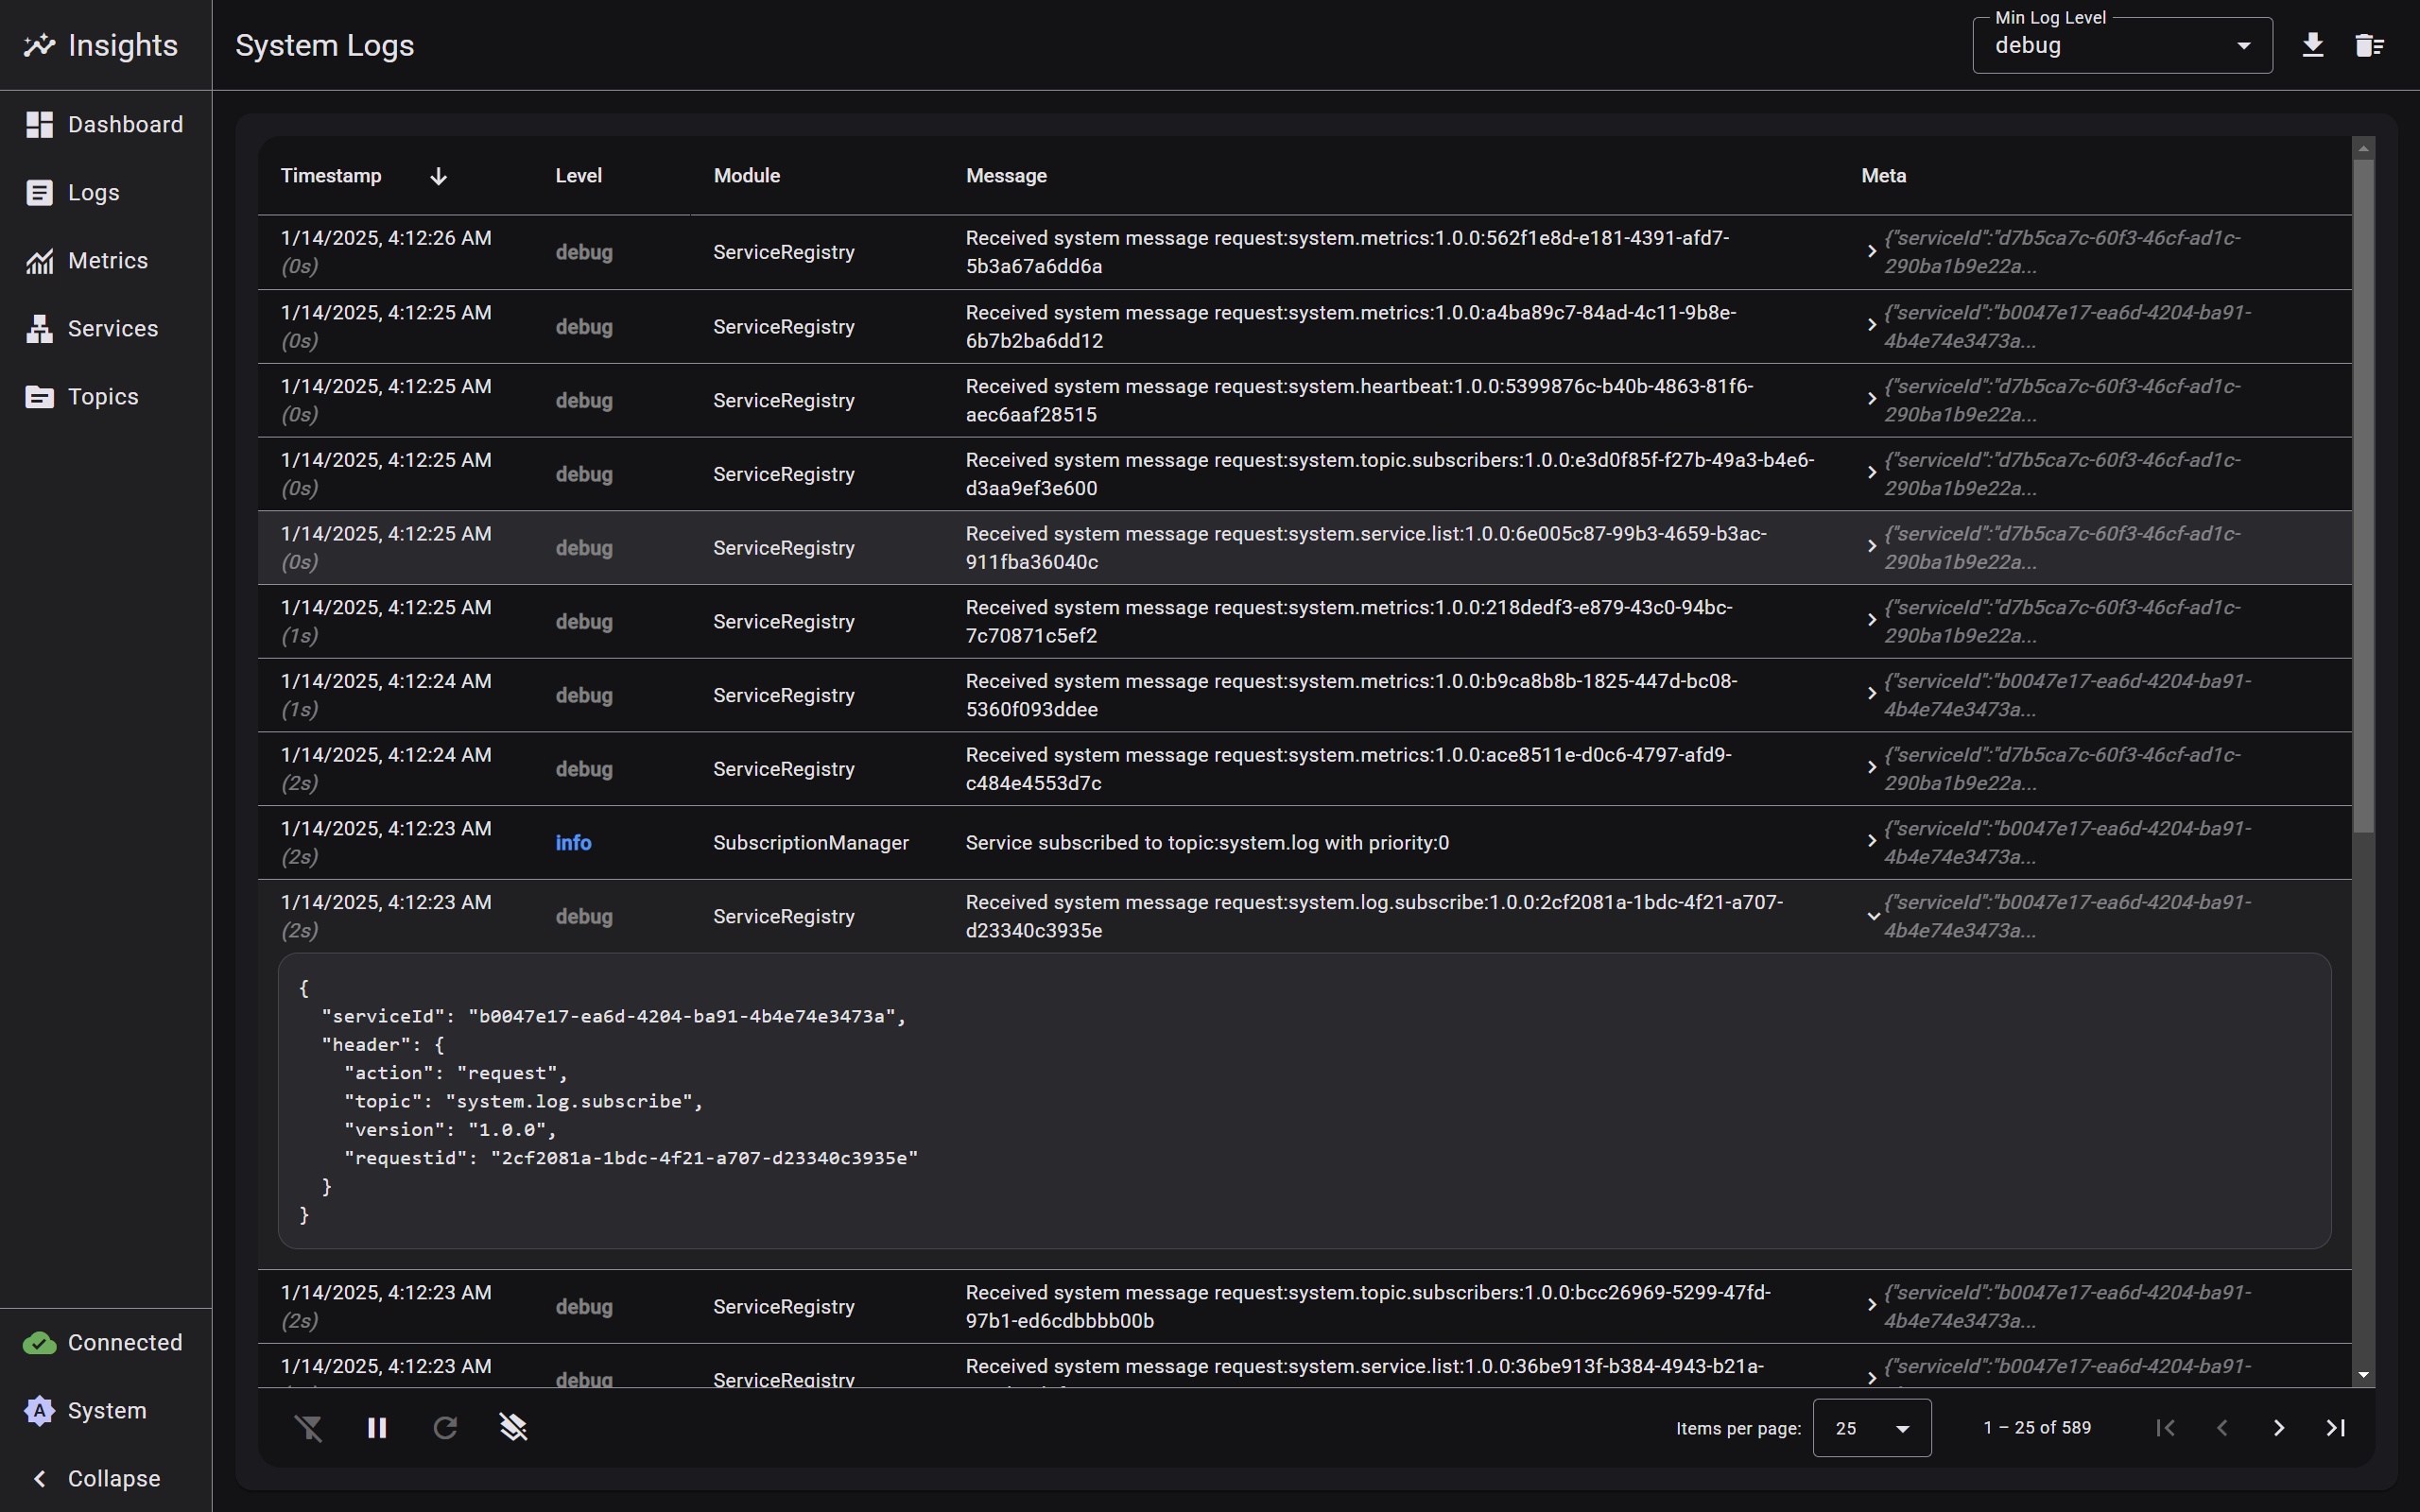
- Real-time log streaming interface
- Multi-level log filtering (DEBUG, INFO, WARN, ERROR)
- Module-based log categorization
- Advanced search and filtering capabilities
- Structured log entry display with metadata
- Automatic log rotation and cleanup
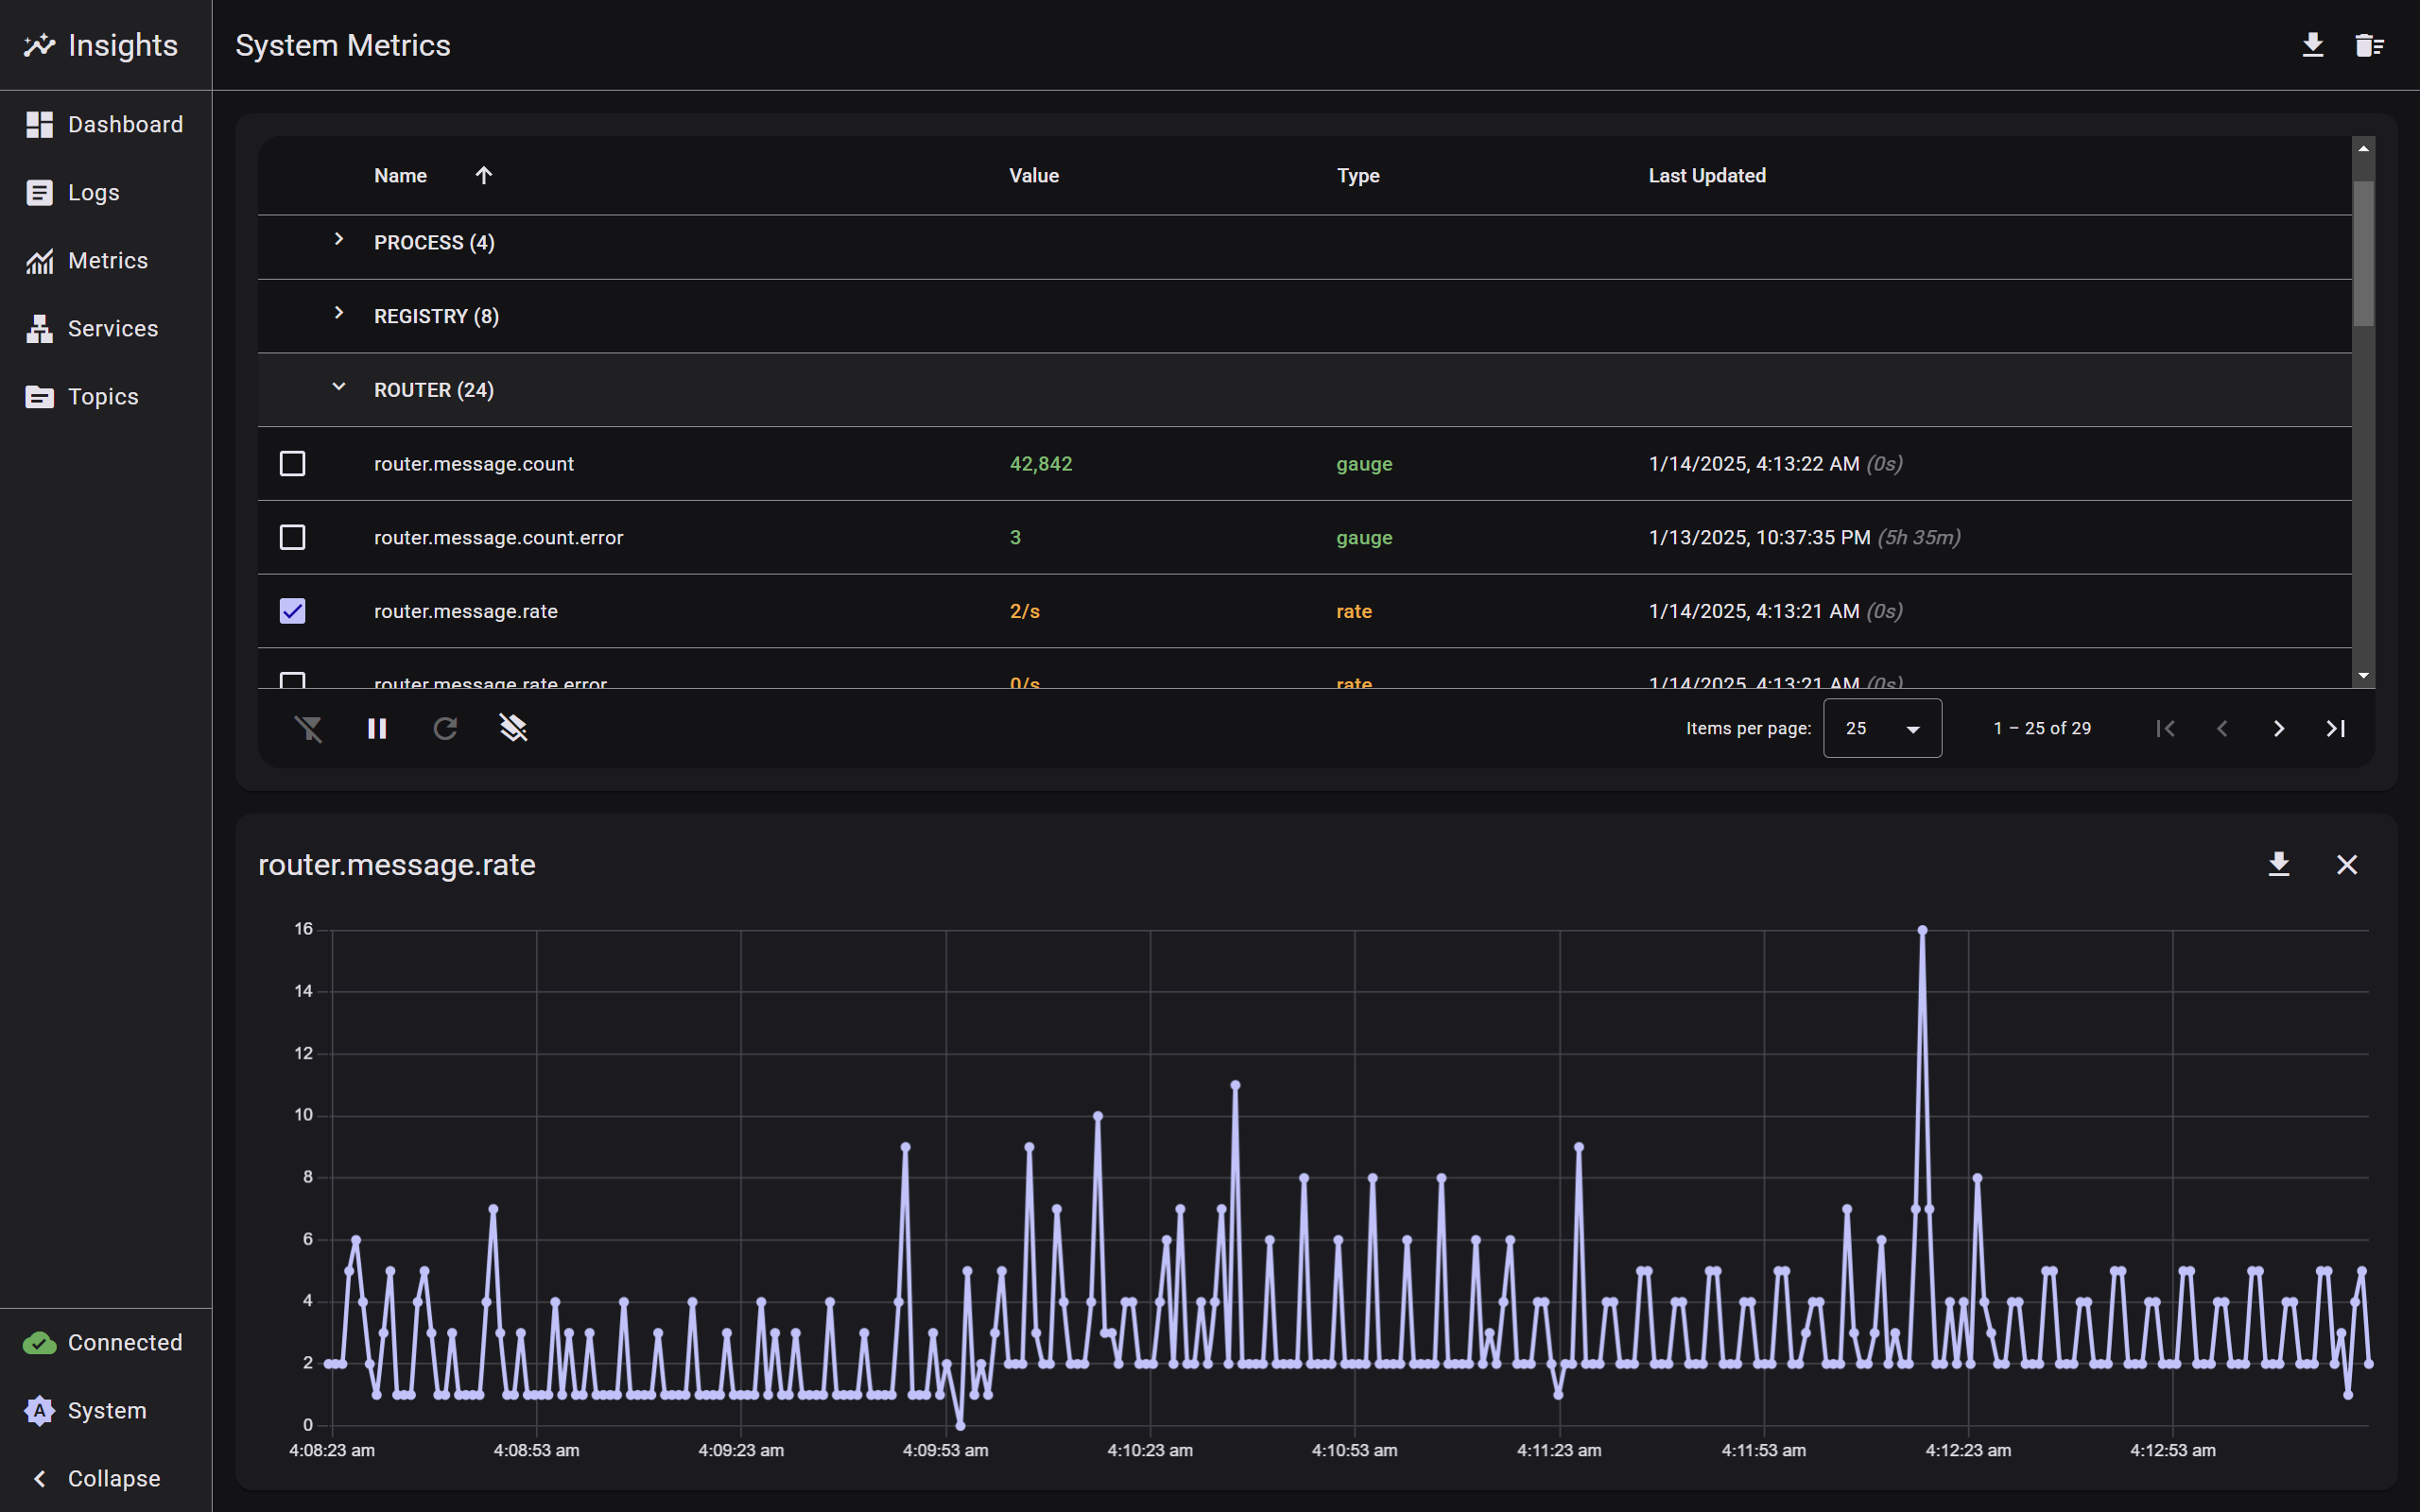
- System-wide performance visualization
- Real-time metric updates with historical trends
- Multiple visualization options for different metric types
- Service-specific metric filtering
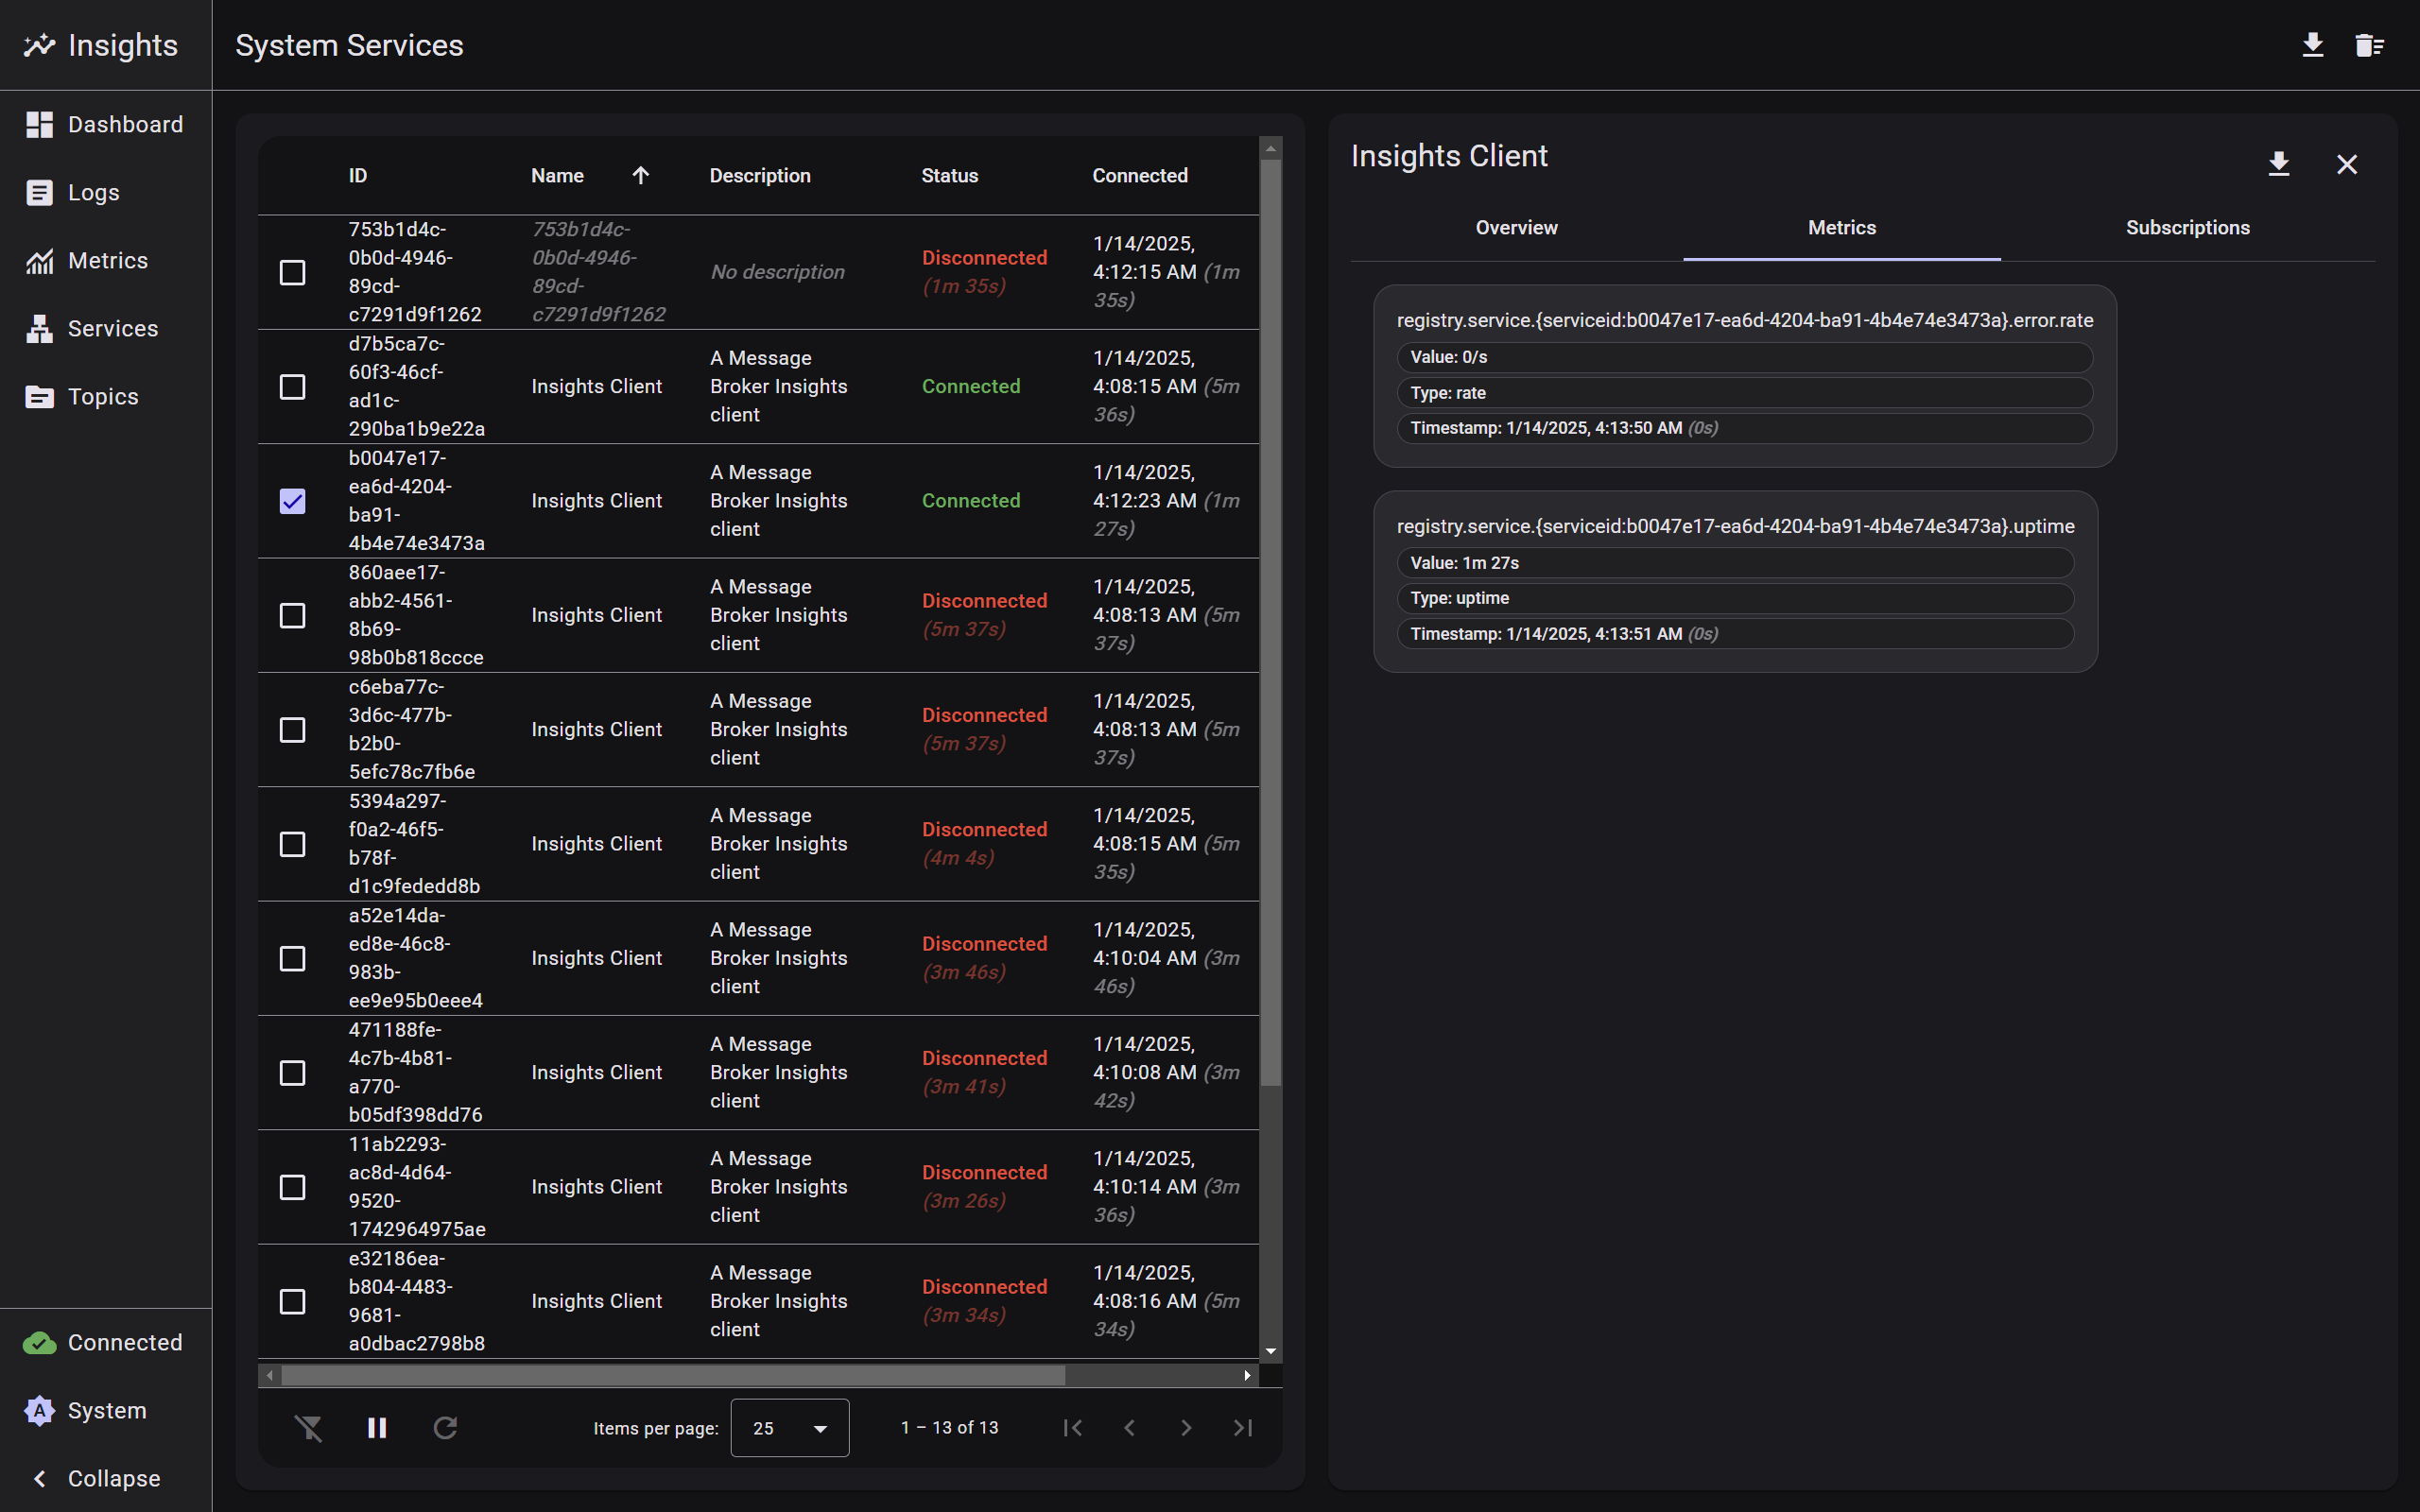
- Comprehensive list of all connected and recently disconnected services
- Real-time status indicators and heartbeat monitoring
- Expandable service details showing metadata and metrics
- Service-specific subscription information
- Filtering and sorting capabilities
- Historical connection tracking
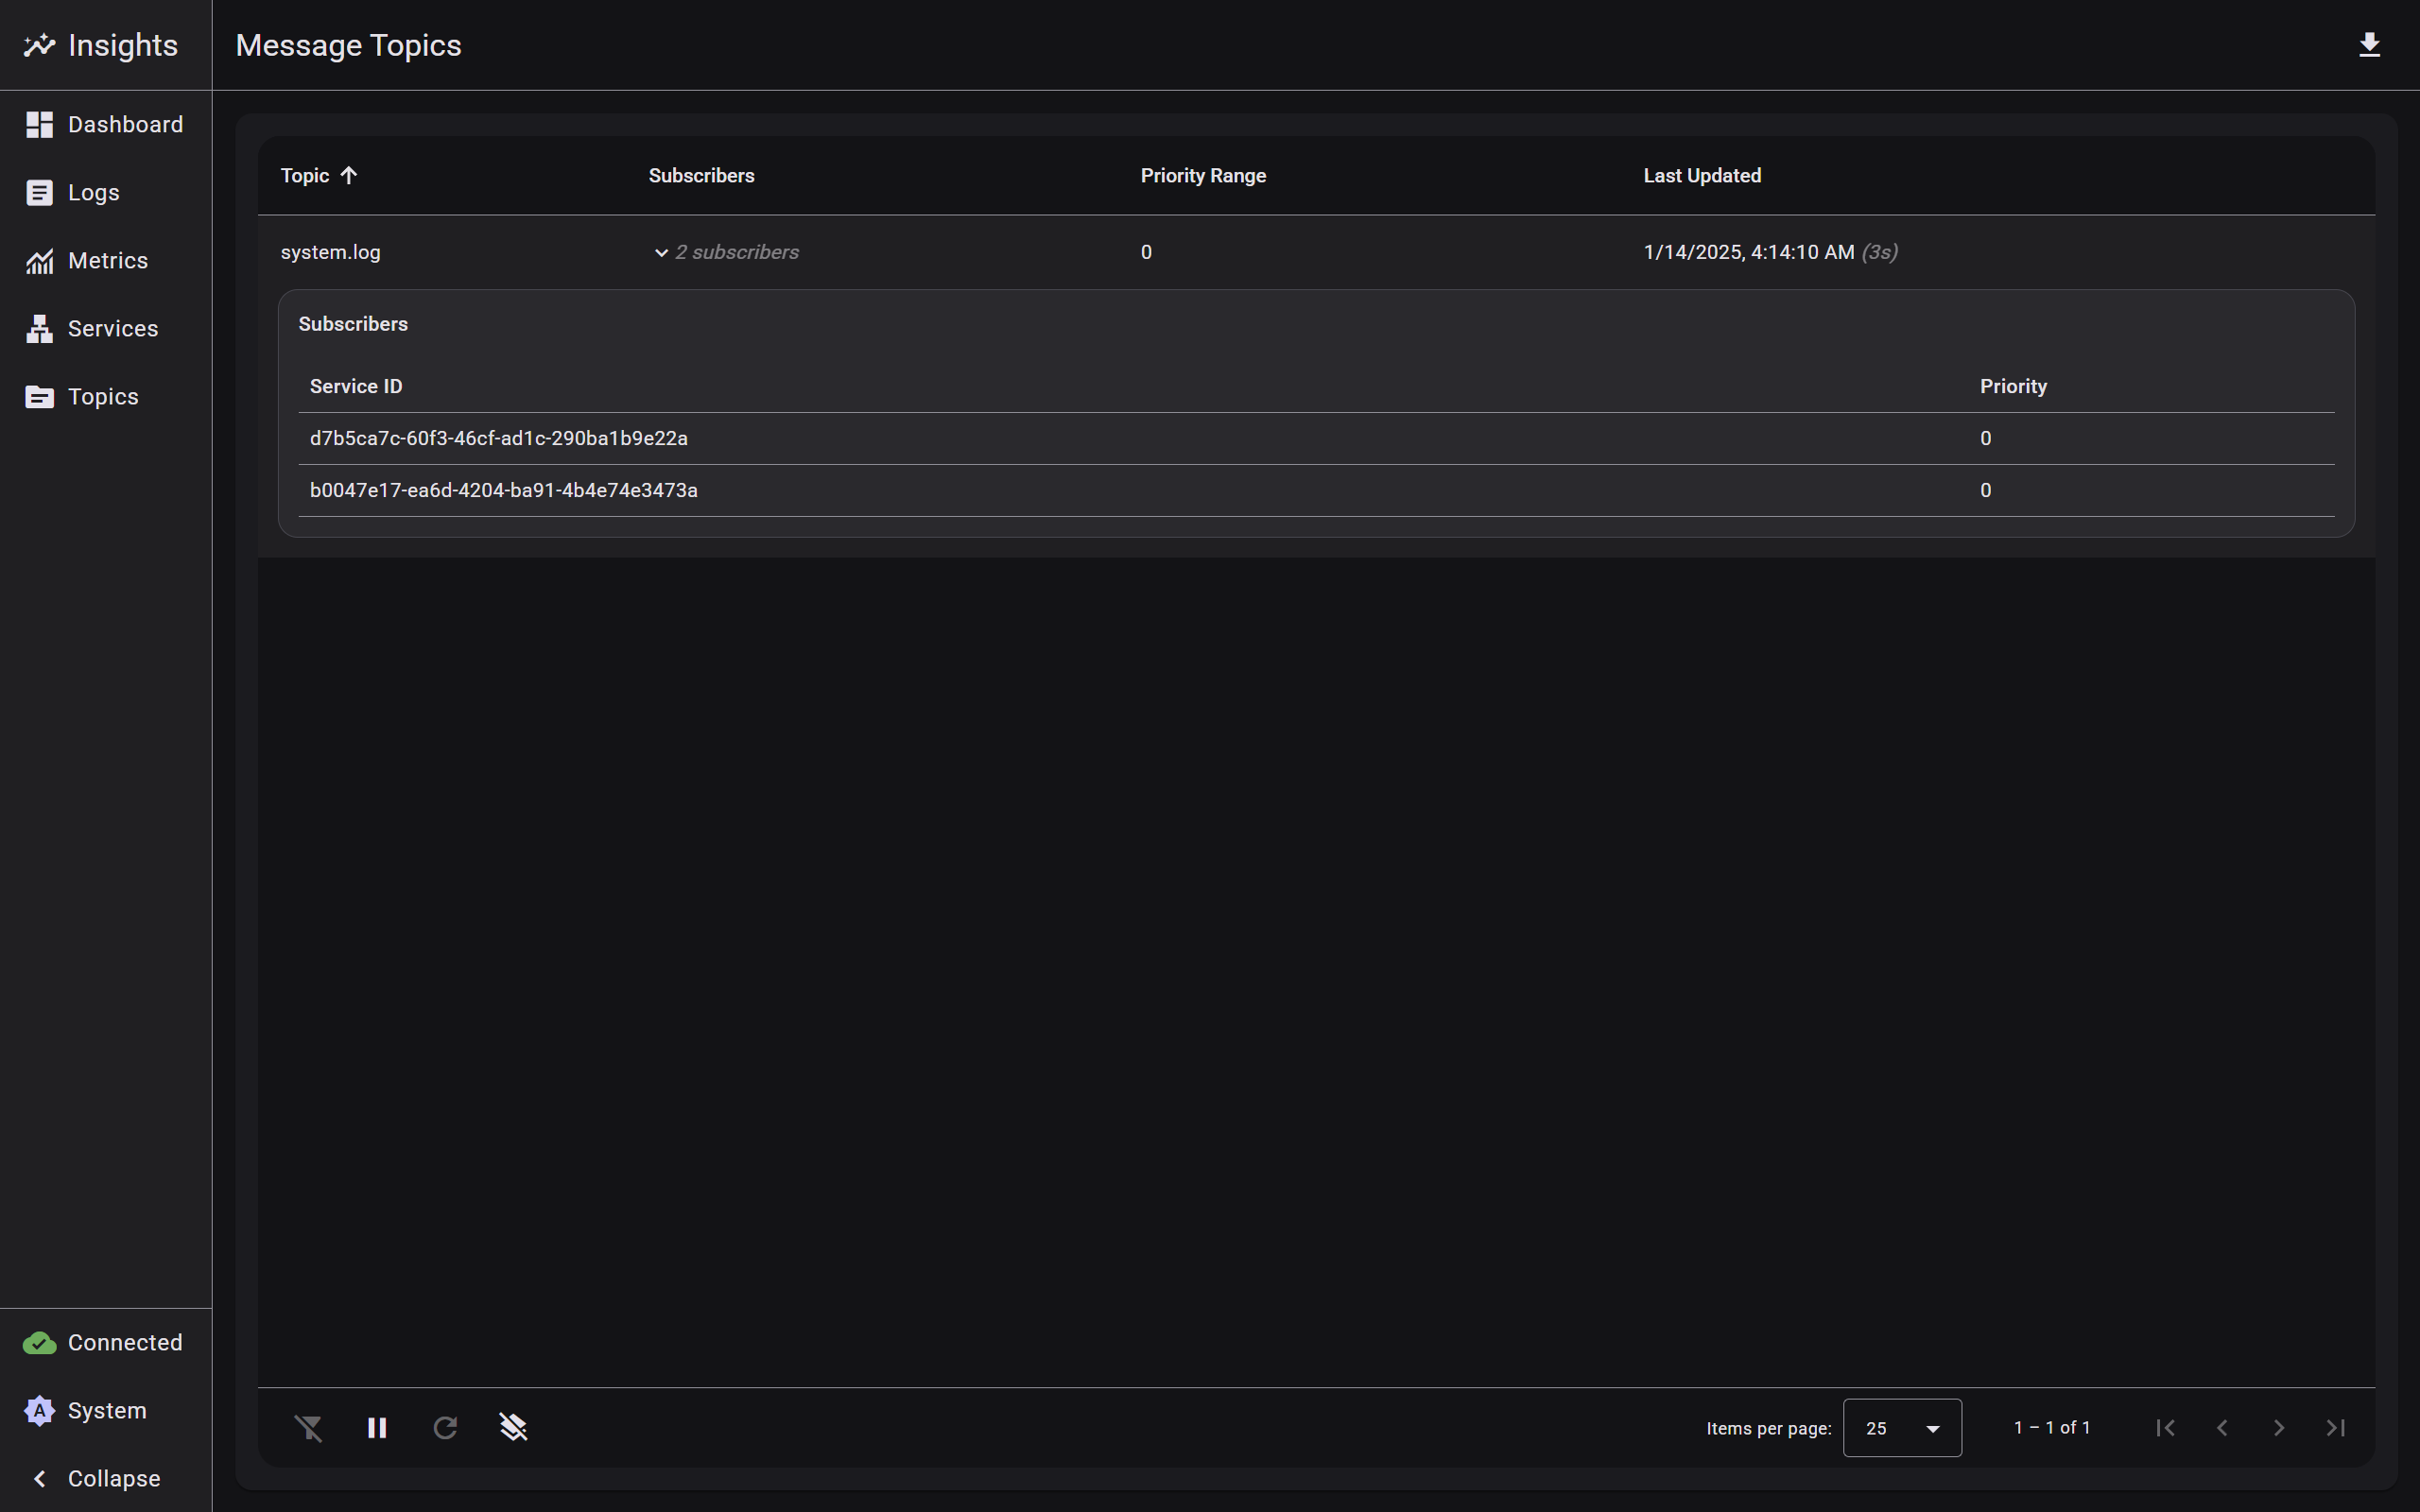
- Complete overview of all subscribed message topics
- Real-time subscriber count and priority information
- Detailed subscriber lists with service associations
- Advanced filtering by topic name and subscribers
- Node.js 18.x or higher
- npm 9.x or higher
- Angular CLI 19.x or higher
- Modern web browser with WebSocket support
Core dependencies:
- Angular 19.0.0
- Angular Material 19.0.5
- Chart.js 4.4.7
- RxJS 7.8.0
- UUID 11.0.5
Development dependencies:
- TypeScript 5.6.2
- Jasmine 5.4.0
- Karma 6.4.0
# Clone the repository
git clone https://github.com/DeX-Group-LLC/mb-insights.git

# Navigate to project directory
cd mb-insights

# Install dependencies
npm install

# Start the application
npm start
The application will be available at http://localhost:4200. Make sure you have a Message Broker instance running at ws://localhost:3000 or configure the connection URL in the application settings.
Build the application for production:
# Production build
npm run build
# or
ng build --configuration production
The build artifacts will be stored in the dist/ directory.
Run unit tests with Karma:
npm test
# or
ng testThe web interface is built with a modular architecture:
-
WebsocketService:
- Manages WebSocket communication with automatic reconnection
- Handles connection state management and heartbeat monitoring
- Implements request/response pattern with UUID tracking
- Provides connection event history and latency tracking
- Advanced error handling and recovery mechanisms
-
MetricsService:
- Manages system metrics collection and visualization
- Supports multiple metric types (gauge, rate, uptime, percent)
- Maintains 5-minute historical buffer
- Handles automatic metric updates and formatting
- CPU and Memory usage tracking
- Message rate and size analytics
-
ServicesService:
- Manages service discovery and monitoring
- Tracks service status and metadata
- Handles service-specific metrics and subscriptions
- Maintains history of disconnected services
-
TopicsService:
- Manages topic subscriptions and updates
- Tracks subscriber counts and priorities
- Handles automatic topic cleanup
- Provides real-time topic updates
-
LogService:
- Manages structured logging with multiple levels
- Handles log entry metadata and module tracking
- Provides real-time log streaming
- Supports advanced filtering
-
ThemeService:
- Dynamic theme management with Material Design 3
- Light/Dark mode support
- Custom color palette support
- Real-time theme switching
- System preference detection
-
DashboardComponent:
- Real-time system metrics visualization
- Interactive charts with Chart.js
- CPU and Memory usage tracking
- Service status overview
- Recent logs display
-
LayoutComponent: Main application layout with responsive navigation
-
LogsComponent: Real-time log viewing and filtering interface
-
MetricsComponent: System metrics visualization and analysis
-
ServicesComponent: Service management and monitoring interface
-
TopicsComponent: Topic management and subscriber monitoring interface
-
TableComponent: Reusable table component with sorting and filtering
- Component-based architecture
- Reactive programming with RxJS
- Dependency injection
- Observable data streams
- Event-driven communication
- Singleton services
- Smart data management with buffer limits
- Automatic cleanup of stale data
-
Real-time Updates:
- Automatic data polling with configurable intervals
- WebSocket-based real-time updates
- Smart data buffer management
- Automatic cleanup of stale data
-
State Management:
- Reactive state updates with BehaviorSubjects
- Loading state tracking
- Error handling and recovery
- Automatic reconnection logic
-
Data Formatting:
- Smart metric value formatting
- Timestamp formatting
- Metadata extraction and management
- Priority-based sorting
We welcome contributions! Please follow these steps:
- Fork the repository
- Create a feature branch (
git checkout -b feature/improvement) - Make your changes
- Run tests (
npm test) - Commit your changes (
git commit -am 'Add new feature') - Push to the branch (
git push origin feature/improvement) - Create a Pull Request
- Follow Angular style guide
- Write comprehensive unit tests
- Document new features and changes
- Ensure responsive design
- Maintain accessibility standards
- Use TypeScript strict mode
- Follow Material Design principles