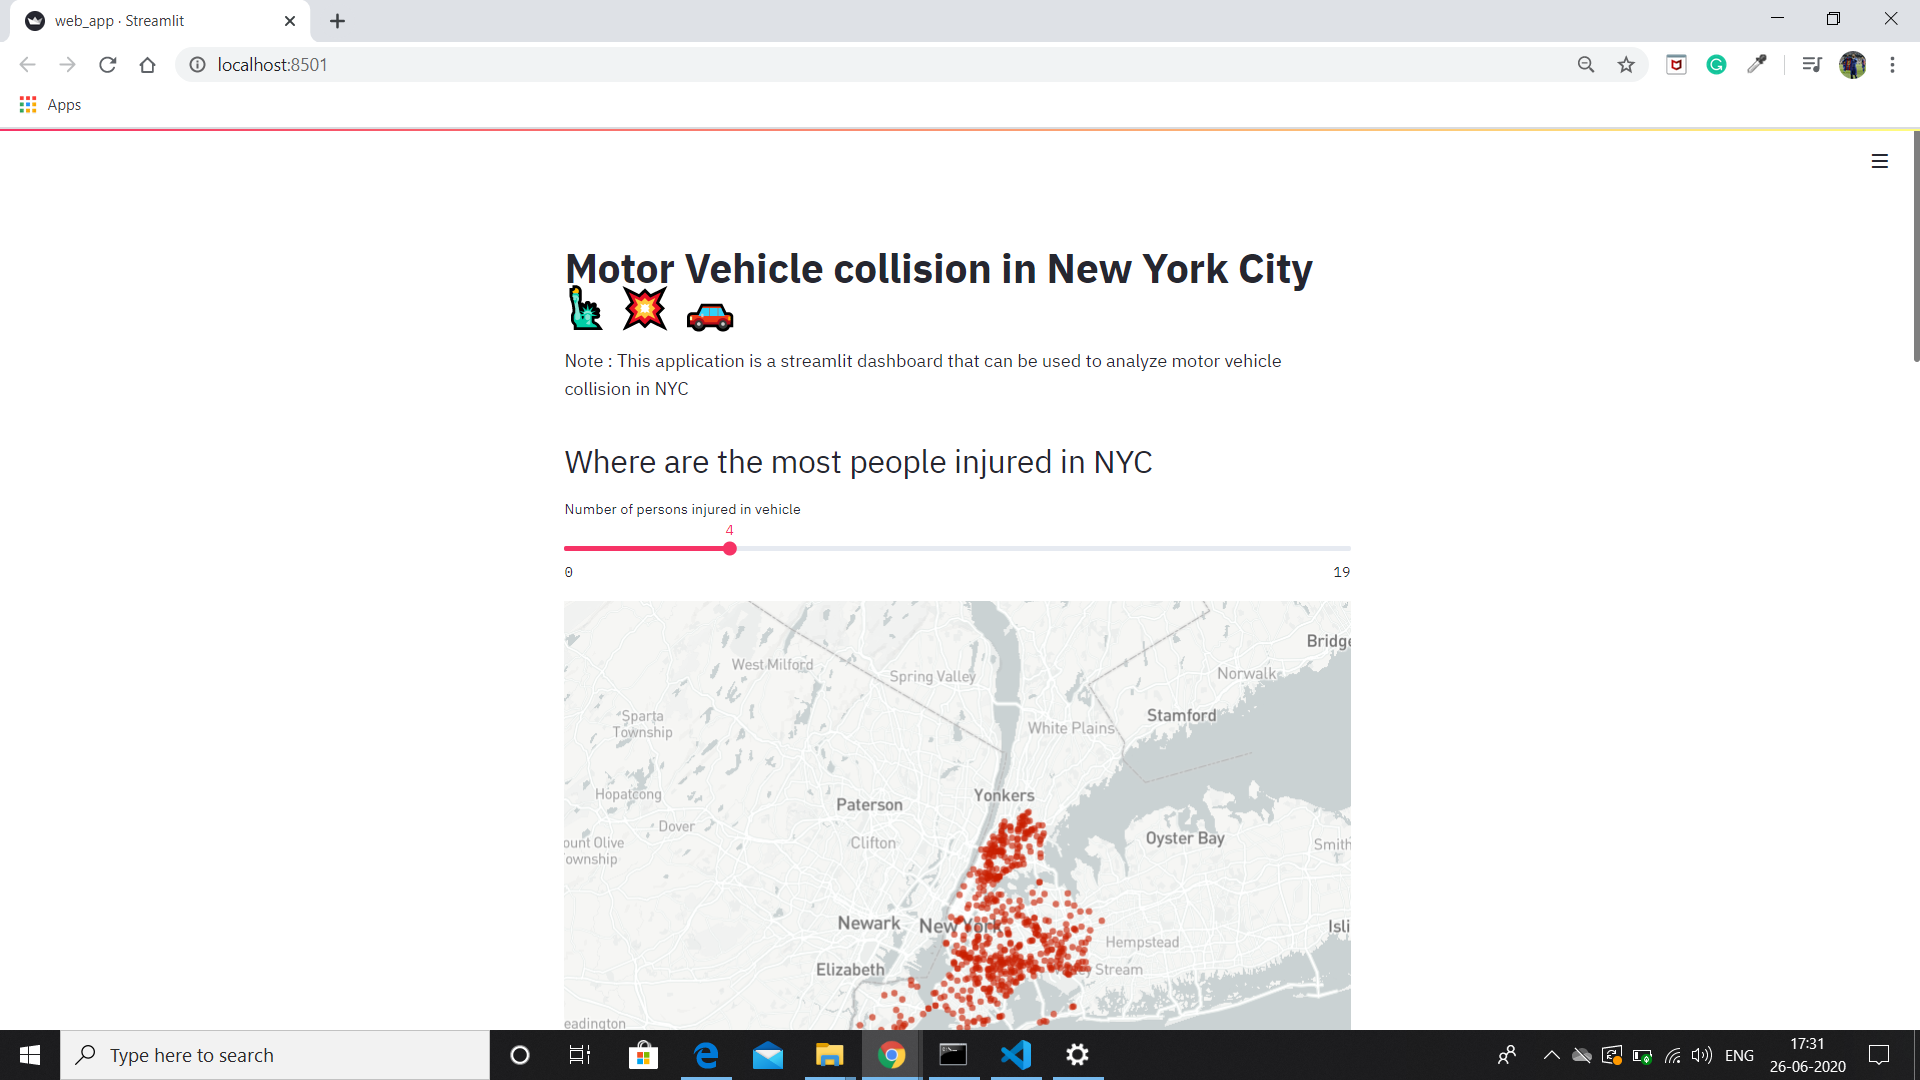
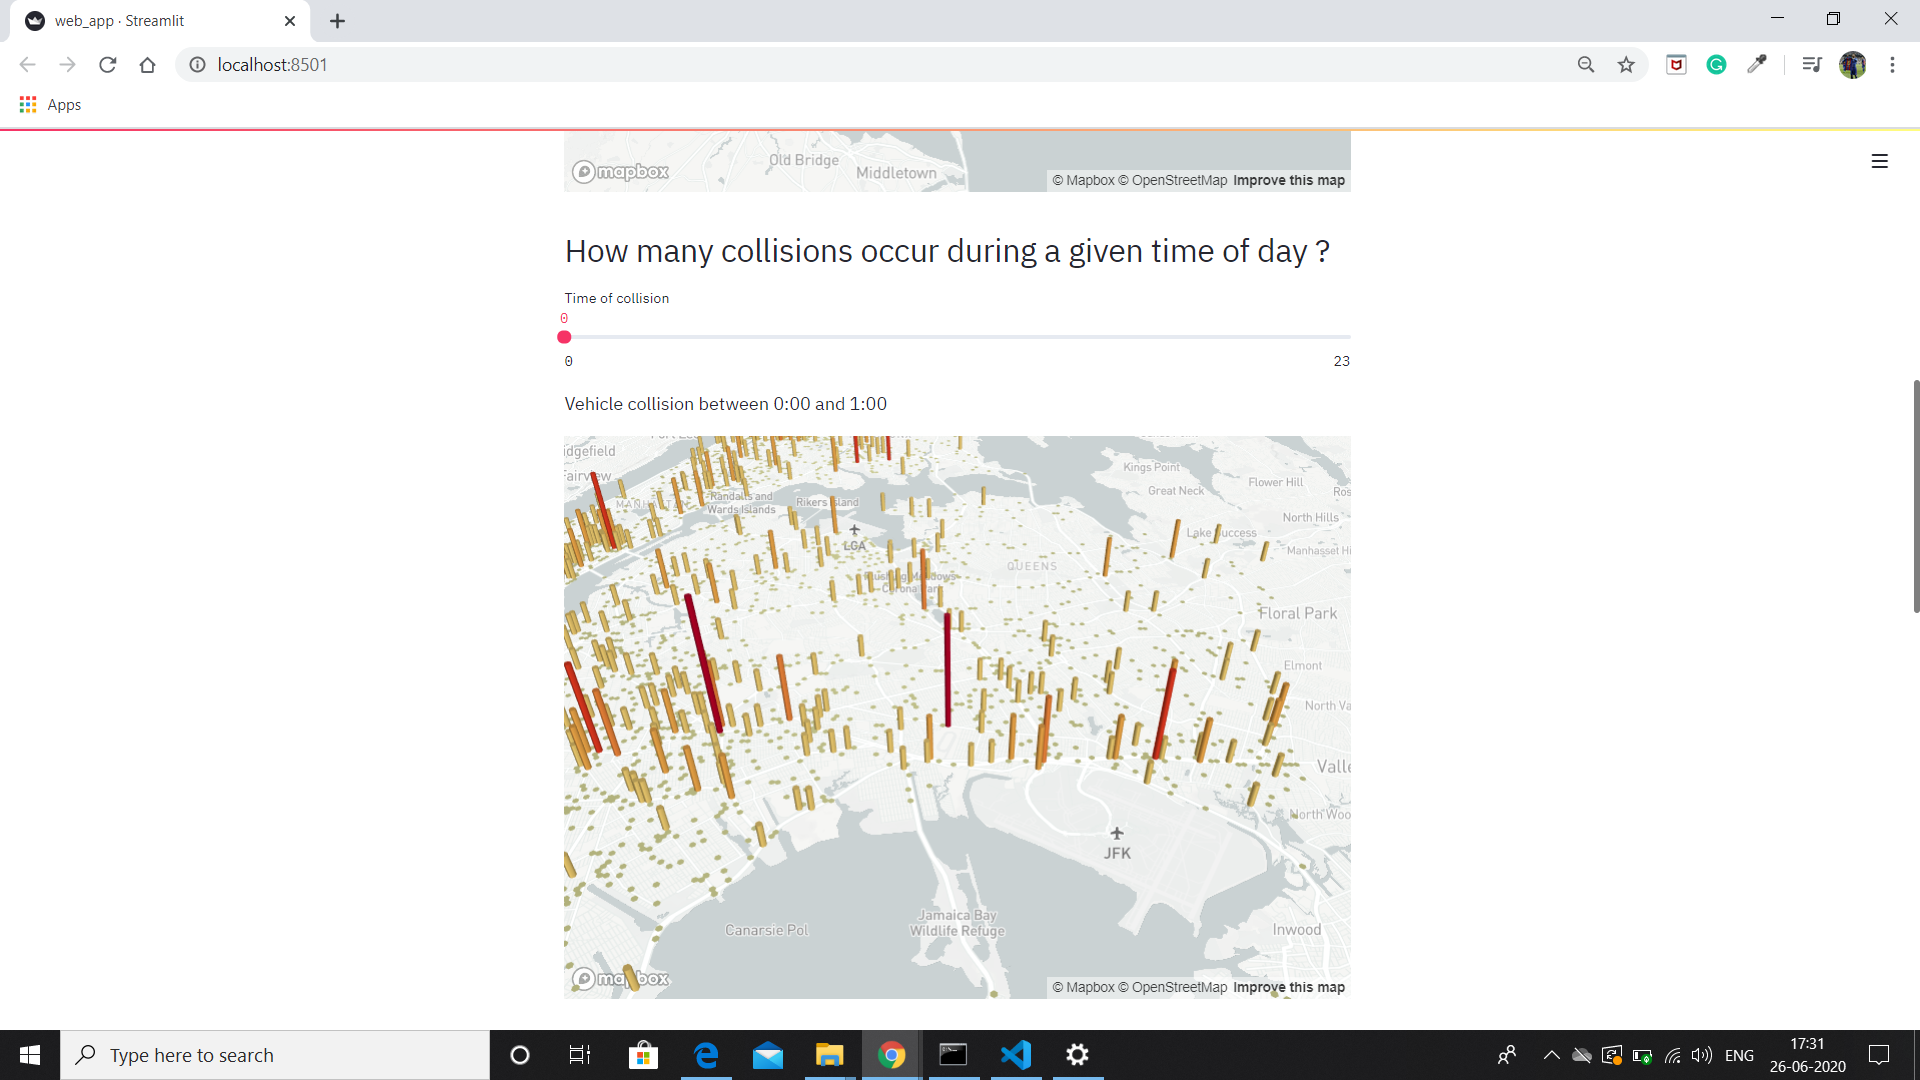
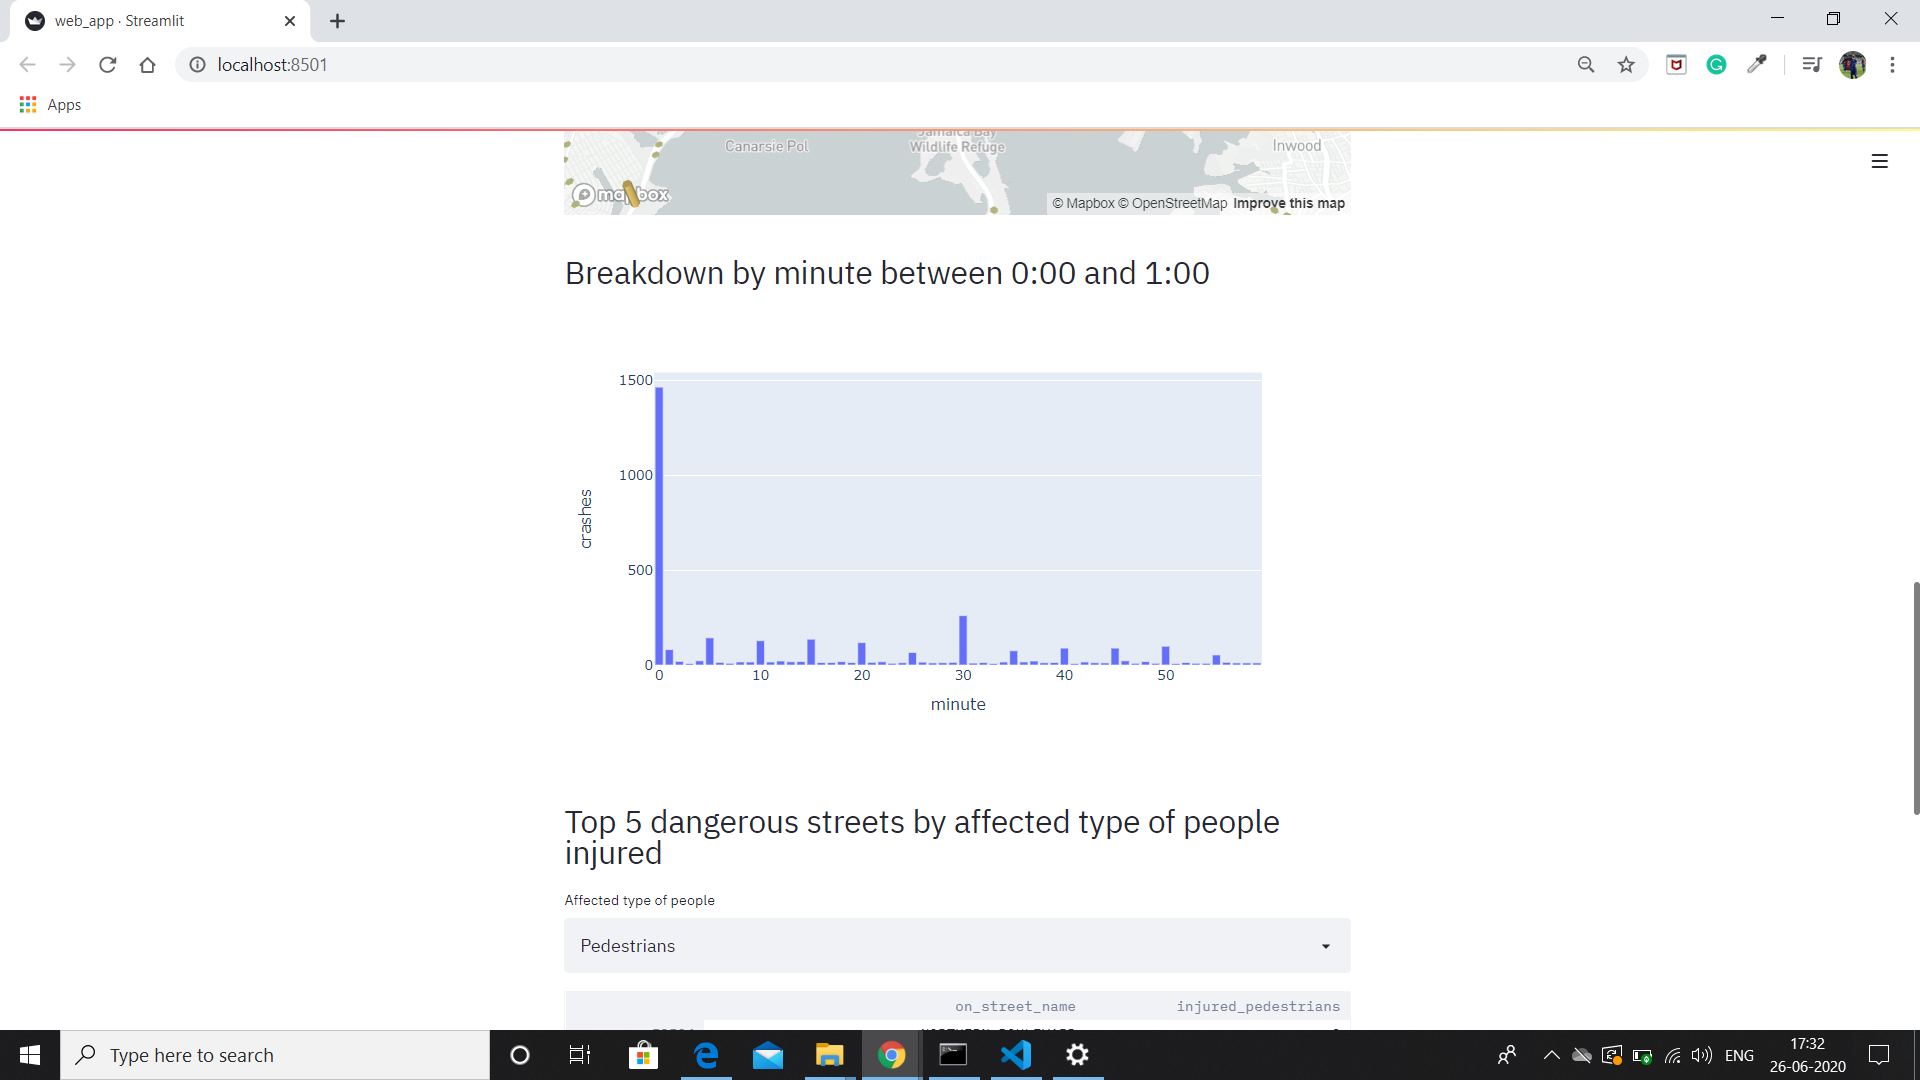
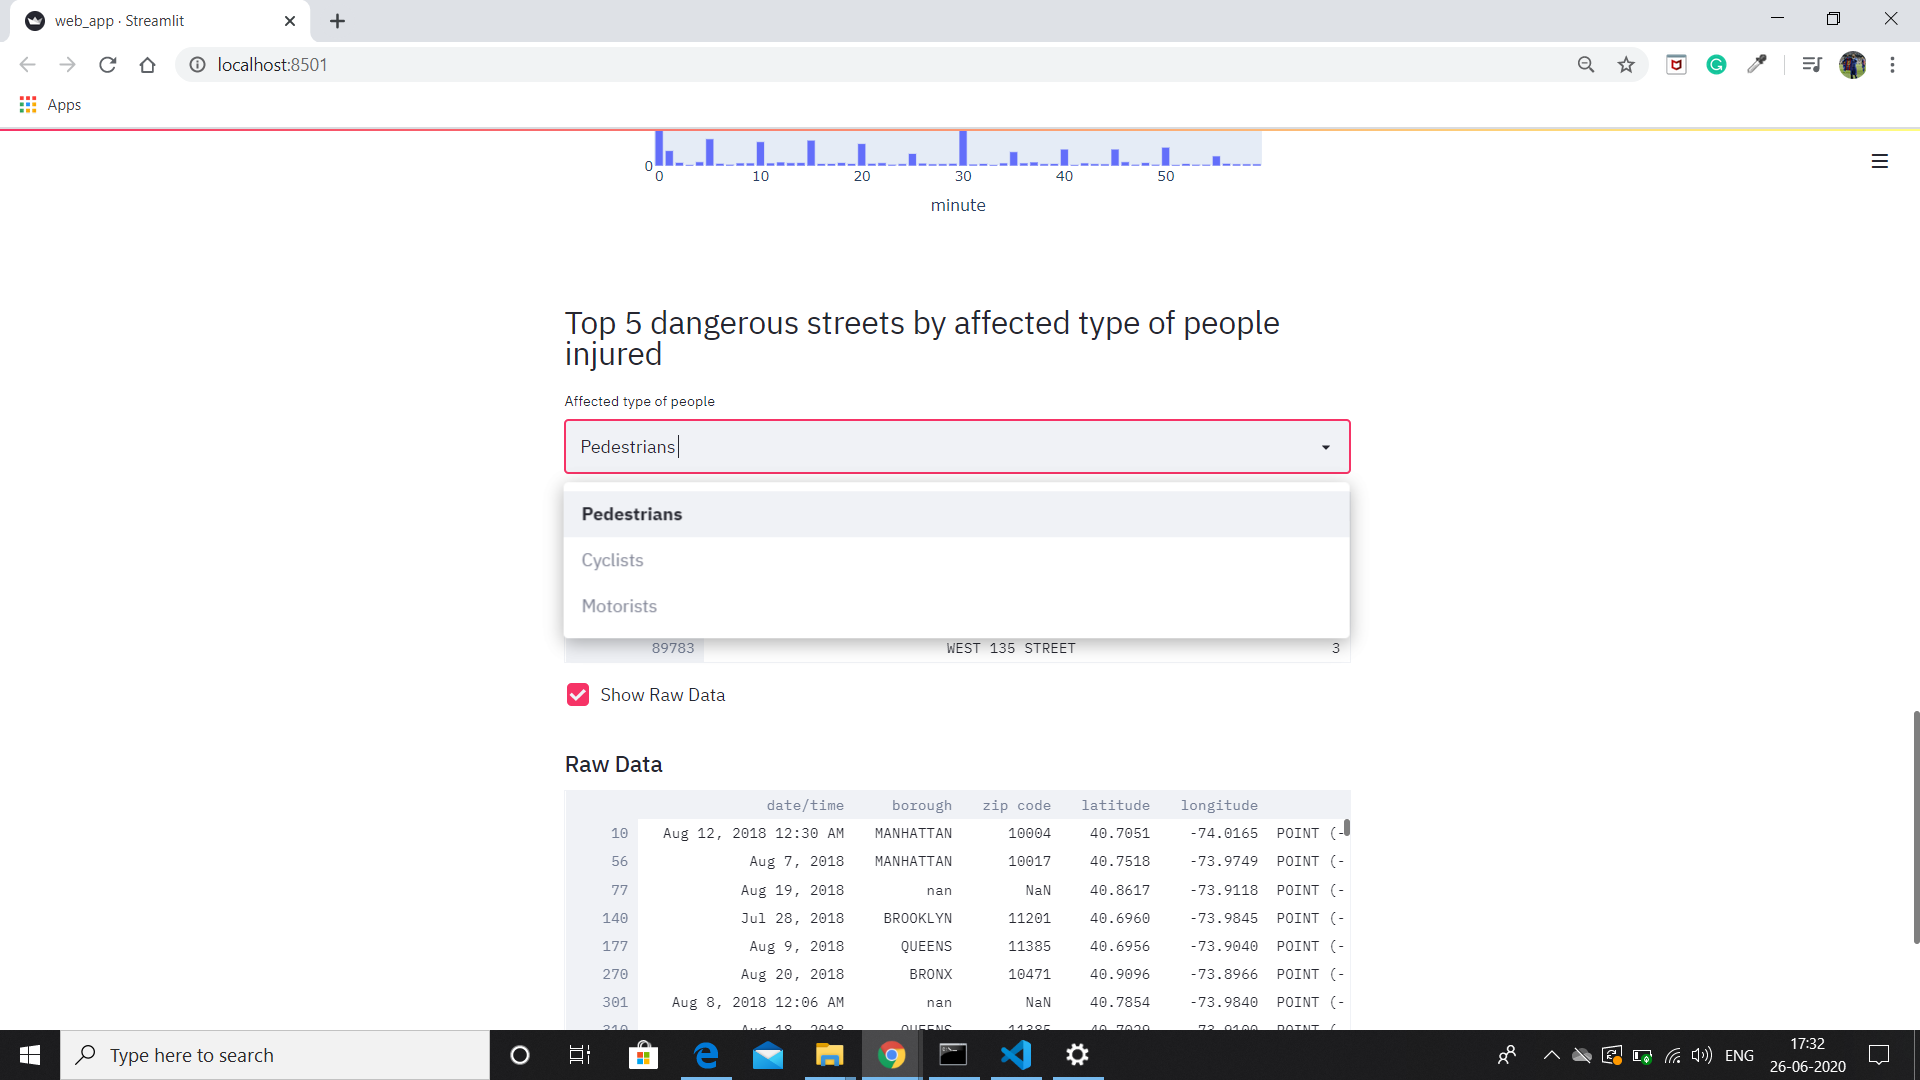
This is a Data Science Web app created using Streamlit and Python. This app is used to analyse the different aspects of the dataset in interactive way. The dataset used here is "Motor_Vehicle_Collisions_-_Crashes.csv" which shows the different attributes of the accidents occurred in New York City . The dataset contains 1.6 million rows and 29 columns
link to the dataset = https://catalog.data.gov/dataset/motor-vehicle-crashes-vehicle-information-beginning-2009
libraries to be installed:-
- pandas = pip install pandas
- numpy = pip install numpy
- streamlit = pip install streamlit
- pydeck = pip install pydeck
- plotly.express = pip install plotly-express
Note: The dataset and python file should be present in same folder. Path of the folder should be entered correctly in the "DATA_URL"
To run the program just use the command "streamlit run web_app.py" in the command line.
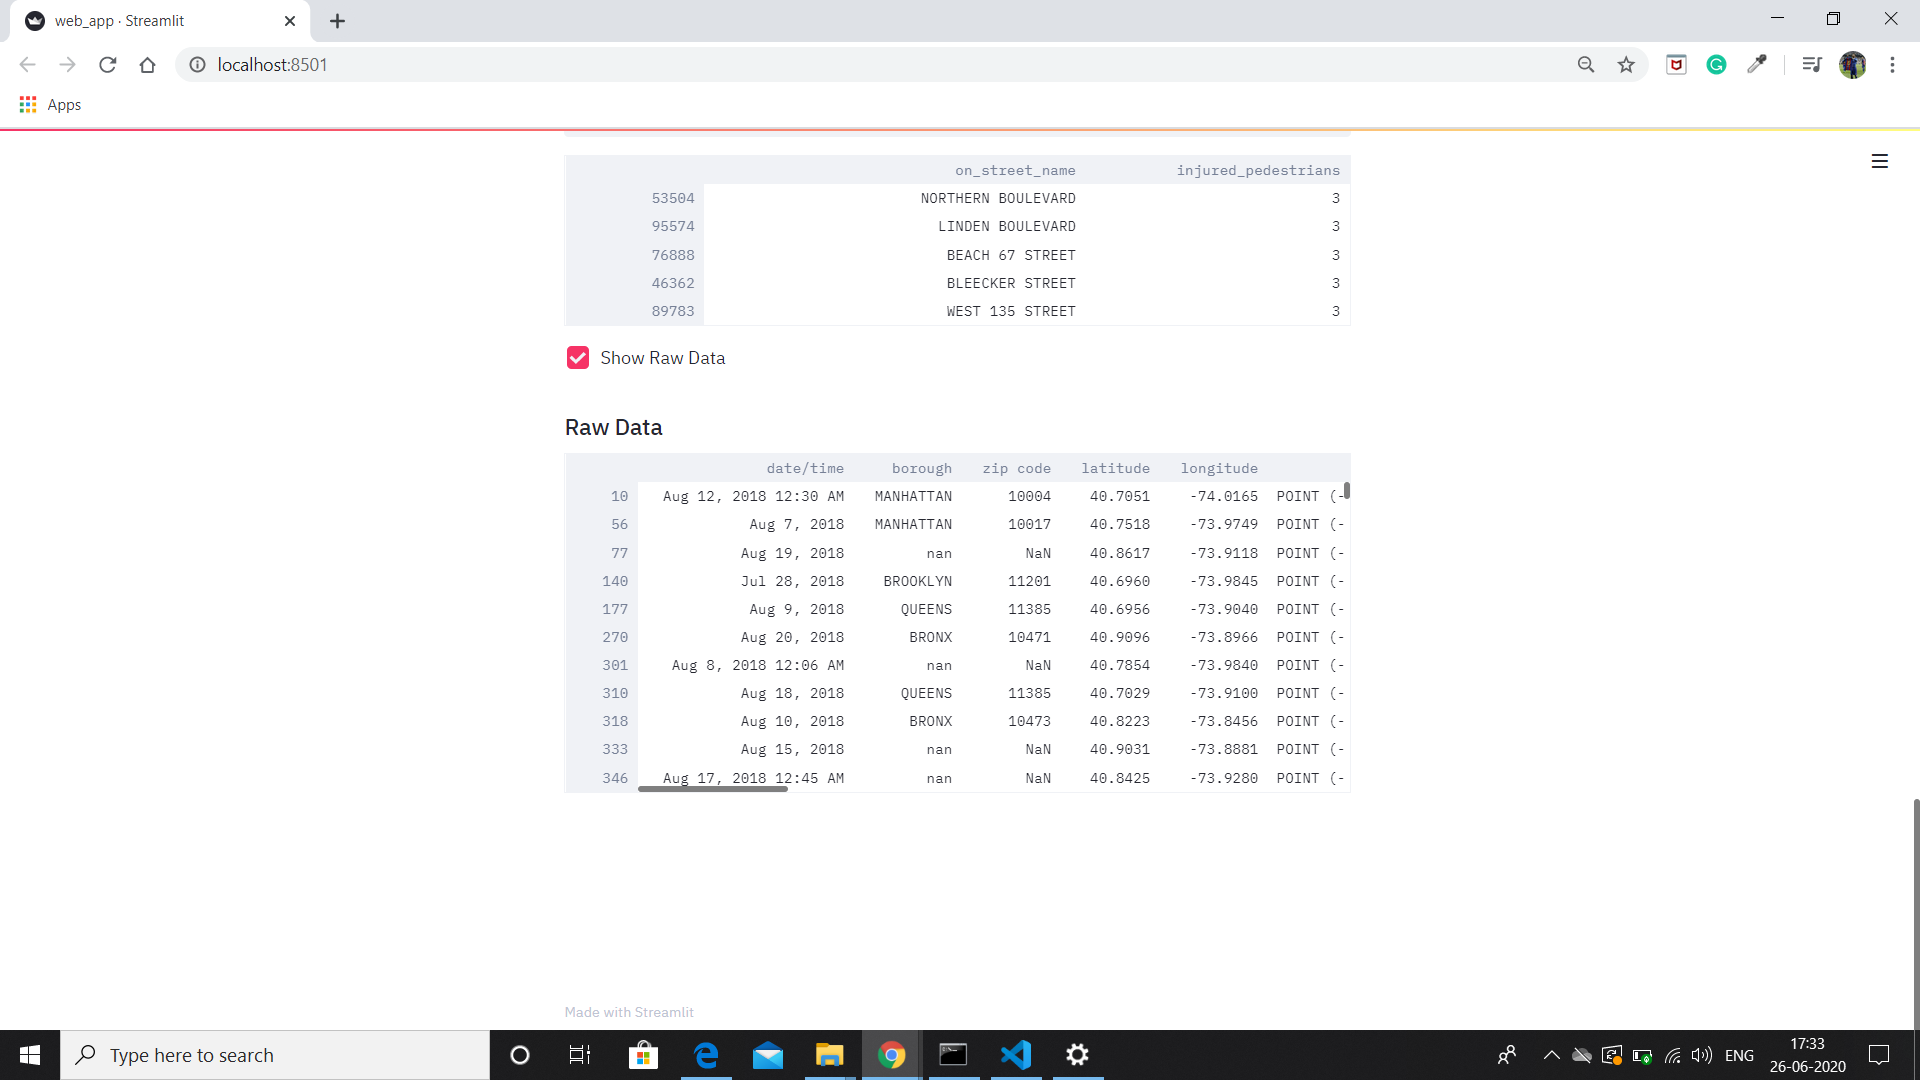
Below are the screensots of my Data Science Web App