A version with a better design, cleaner structure, and AI enable will be release soon. This repository will NOT be updated and maintained anymore. See you in the new version :). Bye. Peng, 20251117

DROMA-DB is a comprehensive database and analysis tool that integrates the largest published studies investigating cancer response to chemical compounds and the associations between drug sensitivity and multi-omics data (mRNA, CNV, protein, mutation, etc.) across various cancer models including PDC (Patient-Derived Cells), PDO (Patient-Derived Organoids), and PDX, human data are under development.

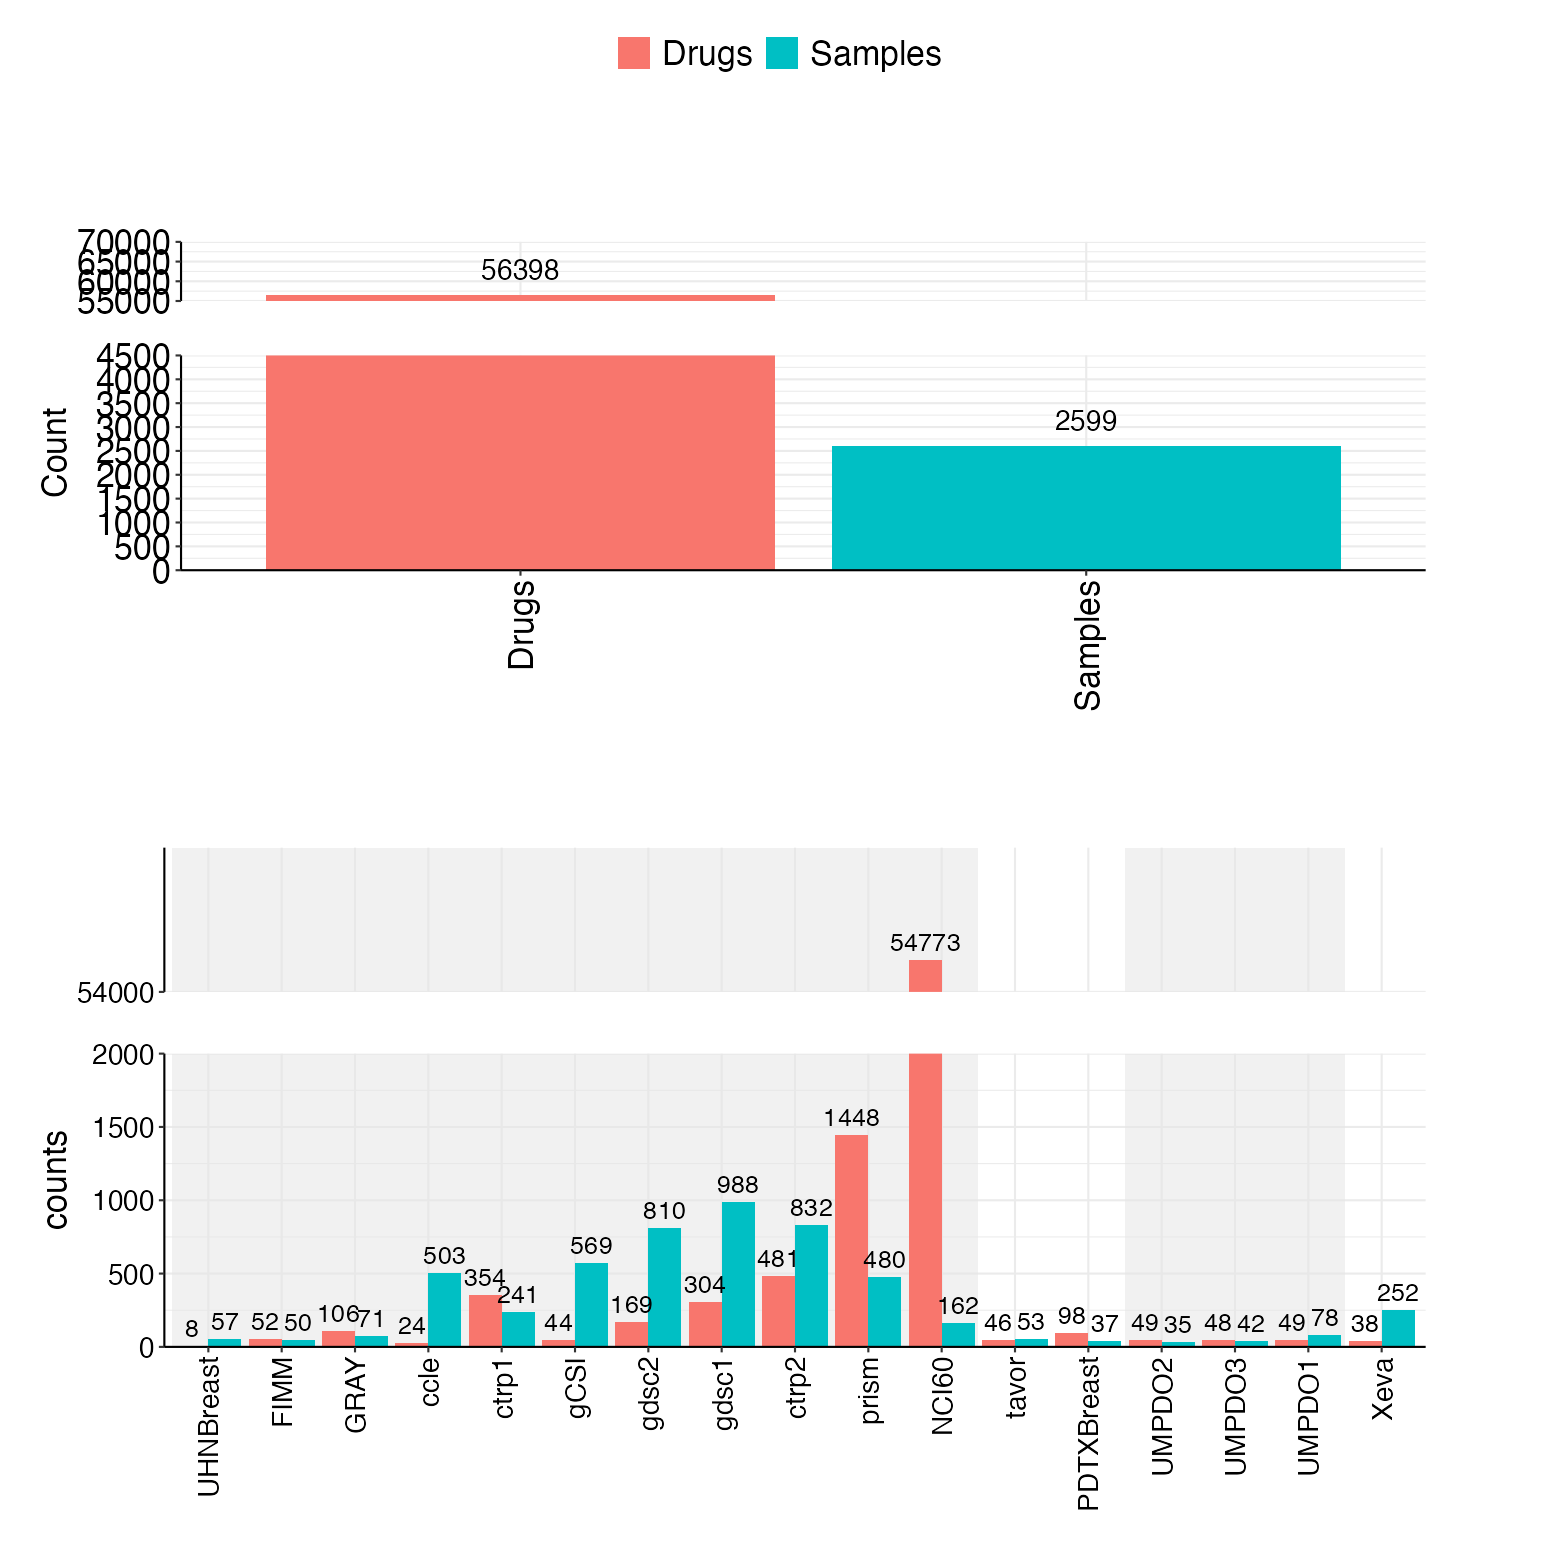
Include 17 datasets now(11 cell line, 2 PDC, 3 PDO, 1 PDX), totally 2599 unique samples and 56398 unique drugs.
If you use DROMA-DB in your research, please cite:
Li, S., Peng, Y., Chen, M. et al. Facilitating integrative and personalized oncology omics analysis with UCSCXenaShiny. Commun Biol 7, 1200 (2024). https://doi.org/10.1038/s42003-024-06891-2
DROMA-DB offers a range of powerful features for cancer pharmacogenomics research:
-
Comprehensive Data Integration: Includes high-throughput cancer type PDO, PDC, PDX data associated between drug sensitivity and multi-omics, as well as in-house data.
-
Drug-Omics Pairs Analysis: Explore associations between specific drug responses and omics features with statistical rigor.
-
Batch Features Associations Analysis: Conduct large-scale analysis of associations between a target feature and all features in a dataset.
-
Filtering Capabilities: Filter analyses by data type (cell lines or PDO) and tumor type for more targeted research.
-
Statistical Visualization: View meta-analysis forest plots, volcano plots, and other visualizations to understand relationships.
-
Data Export: Download results in various formats (PDF, CSV, R objects) for further analysis.
Web application can only be accessed in UM campus: http://fscpo.fhs.um.edu.mo/DROMA_DB/
install the relative packages:
install.packages("pacman")
pacman::p_load(
  shiny,         # Shiny application framework
  shinyWidgets,  # Shiny widgets
  shinyjs,       # JavaScript functionalities for Shiny
  waiter,        # Loading screens and waiters
  DT,            # Data tables for Shiny
  dplyr,         # Data manipulation
  data.table,    # Fast data processing
  meta,          # Meta-analysis
  metafor,       # Meta-analysis with advanced methods
  effsize,       # Effect size calculations
  UpSetR,        # Visualizing set intersections
  ggpubr,        # Publication-ready plots
  plotly,        # Interactive plots
  grid, gridExtra, # plots
  ggrepel,       # label top features
  treemapify,    # tree plot
  patchwork,     # Arranging and combining plots
  snowfall,      # Parallel computing with snow
  parallel       # Parallel computation
)
download the input data to Input/: Input data for DROMA_DB
-
Clone the repository:
git clone https://github.com/yourusername/DROMA-DB.git -
Open the project in RStudio by clicking on the
Project.Rprojfile. -
Run the application:
source("App.R")
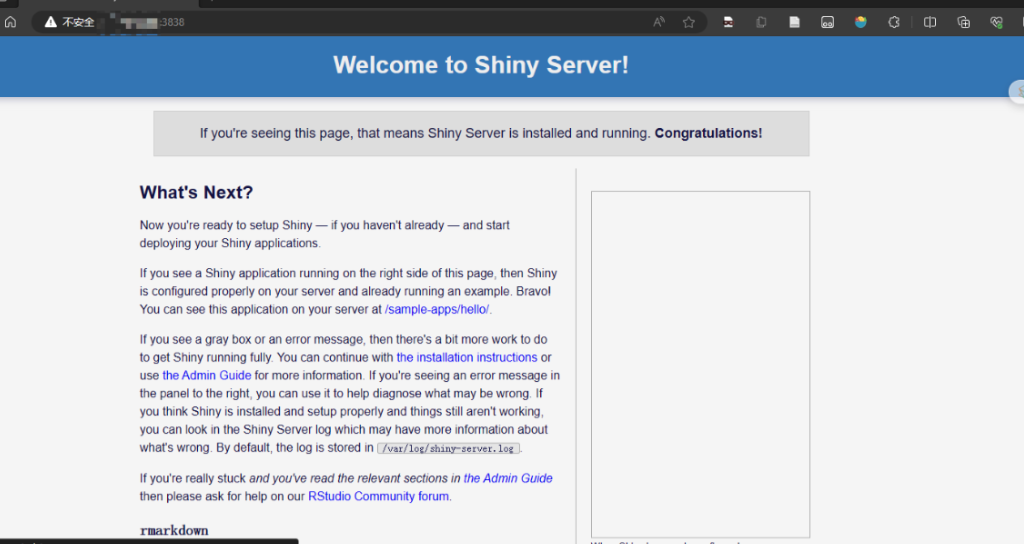
ref: How to Deploy Interactive R Apps with Shiny Server | Linode Docs
sudo apt-get install r-base

sudo R -e "install.packages('shiny', repos = 'https://mirror.tuna.tsinghua.edu.cn/CRAN/')"
shiny must be in system library.
put shiny server content under /srv/shiny-server/, I use soft link:
$ ls  -lh /srv/shiny-server/
total 0
lrwxrwxrwx 1 shiny shiny 21 Jan 21 14:54 DROMA_DB -> /home/shiny/DROMA_DB/
lrwxrwxrwx 1 root  root  38 Apr  3  2024 index.html -> /opt/shiny-server/samples/welcome.html
lrwxrwxrwx 1 shiny shiny 23 Apr  9  2024 OmicsPharDB -> /home/shiny/OmicsPharDB
lrwxrwxrwx 1 root  root  37 Apr  3  2024 sample-apps -> /opt/shiny-server/samples/sample-apps
# bash Miniconda3-latest-Linux-x86_64.sh

# mamba install -y r-base
sudo apt-get install gdebi-core
wget https://download3.rstudio.org/ubuntu-18.04/x86_64/shiny-server-1.5.21.1012-amd64.deb

sudo gdebi shiny-server-1.5.21.1012-amd64.deb
install shiny:
sudo su - -c "R -e \"install.packages('bslib')\""
sudo su - -c "R -e \"install.packages('sass')\""
sudo su - -c "R -e \"install.packages('shiny')\""

# sudo R -e "install.packages('shiny', repos = 'https://mirror.tuna.tsinghua.edu.cn/CRAN/')"
less /etc/shiny-server/shiny-server.conf
# shiny-server.conf
deploy on target ports, I change it from default 3838 to 8888:
$ cat /etc/shiny-server/shiny-server.conf
# Instruct Shiny Server to run applications as the user "shiny"
run_as shiny;

# Define a server that listens on port 8888
server {
  listen 8888;

  # Define a location at the base URL
  location / {

    # Host the directory of Shiny Apps stored in this directory
    site_dir /srv/shiny-server;

    # Log all Shiny output to files in this directory
    log_dir /var/log/shiny-server;

    # When a user visits the base URL rather than a particular application,
    # an index of the applications available in this directory will be shown.
    directory_index on;
  }
}
log:
cat /var/log/shiny-server/
also need to install these packages:
install.packages("pacman")
pacman::p_load(
  shiny,         # Shiny application framework
  shinyWidgets,  # Shiny widgets
  shinyjs,       # JavaScript functionalities for Shiny
  waiter,        # Loading screens and waiters
  DT,            # Data tables for Shiny
  dplyr,         # Data manipulation
  data.table,    # Fast data processing
  meta,          # Meta-analysis
  metafor,       # Meta-analysis with advanced methods
  effsize,       # Effect size calculations
  UpSetR,        # Visualizing set intersections
  ggpubr,        # Publication-ready plots
  plotly,        # Interactive plots
  grid, gridExtra, # plots
  ggrepel,       # label top features
  treemapify,    # tree plot
  patchwork,     # Arranging and combining plots
  snowfall,      # Parallel computing with snow
  parallel       # Parallel computation
)
start shiny:
sudo systemctl start shiny-server
sudo systemctl stop shiny-server
sudo systemctl restart shiny-server
# or
service shiny-server status
service shiny-server restart
service shiny-server stop
DROMA-DB consists of two main sections:
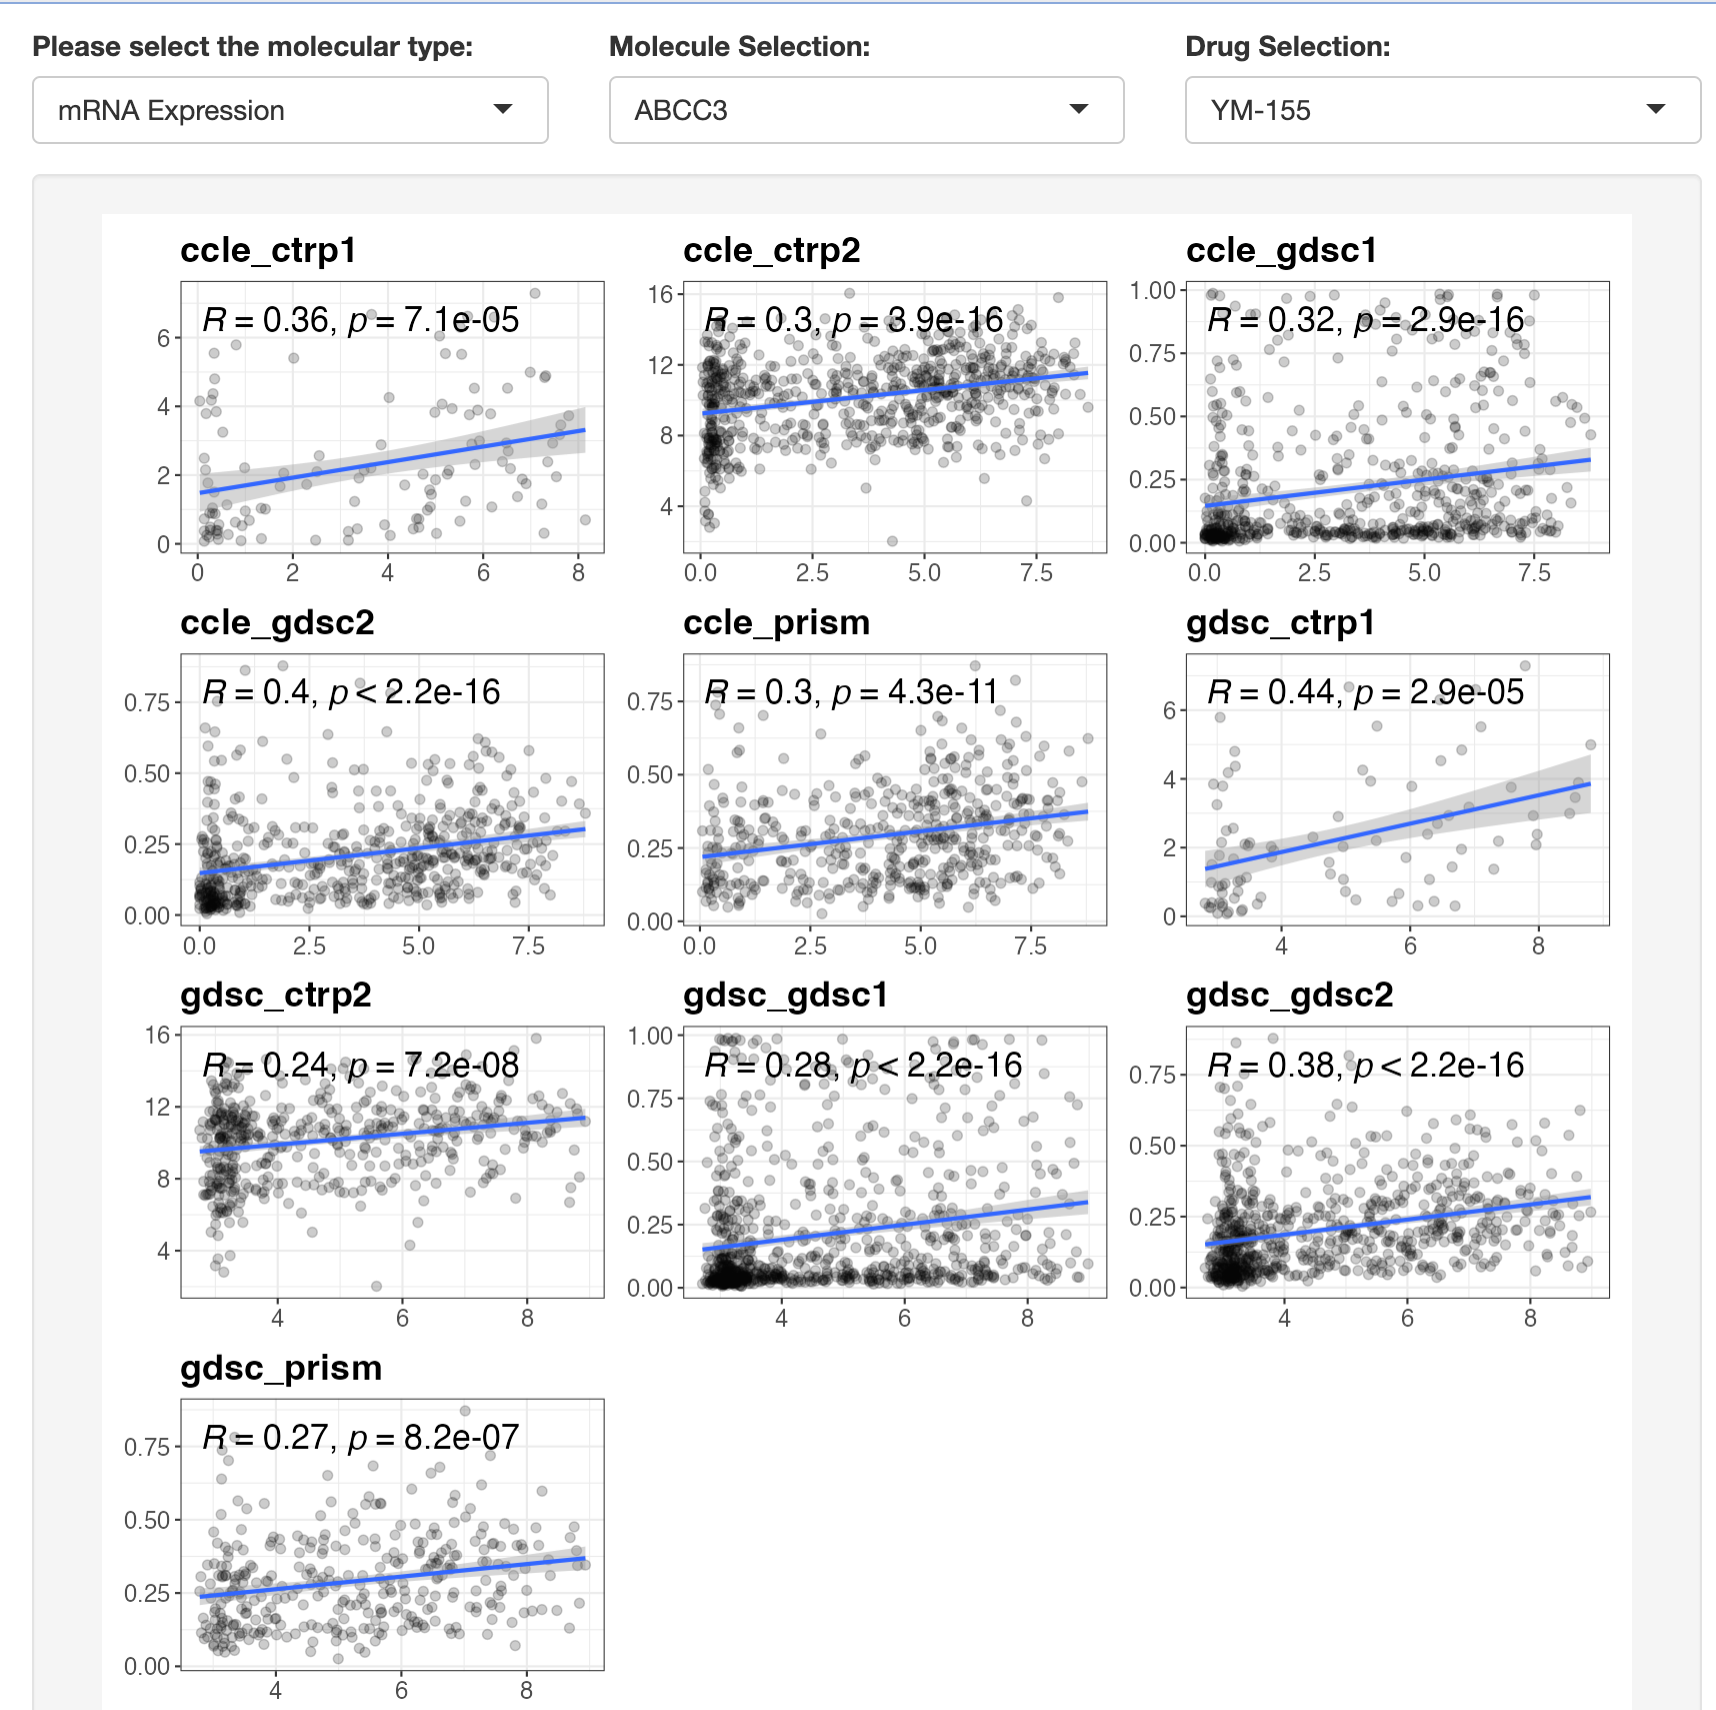
This module allows you to explore the association between a selected drug resistance event and a specific omic feature:
- Select a molecular type (mRNA, CNV, mutation, etc.)
- Choose a specific molecular feature
- Select a drug of interest
- Filter by data type (cell lines or PDO) and tumor type
- View statistical results and visualizations
For continuous omics data (mRNA, methylation, CNV, protein), Spearman correlation is calculated. For discrete omics data (mutations, fusions), Wilcoxon tests are used.
This module helps you conduct significant tests between a targeted feature (a drug or an omic) and all features in a particular dataset:
- Select a feature type and specific feature
- Choose a second feature type to compare against
- Filter by data type and tumor type
- View results as a volcano plot
- Download results for further analysis
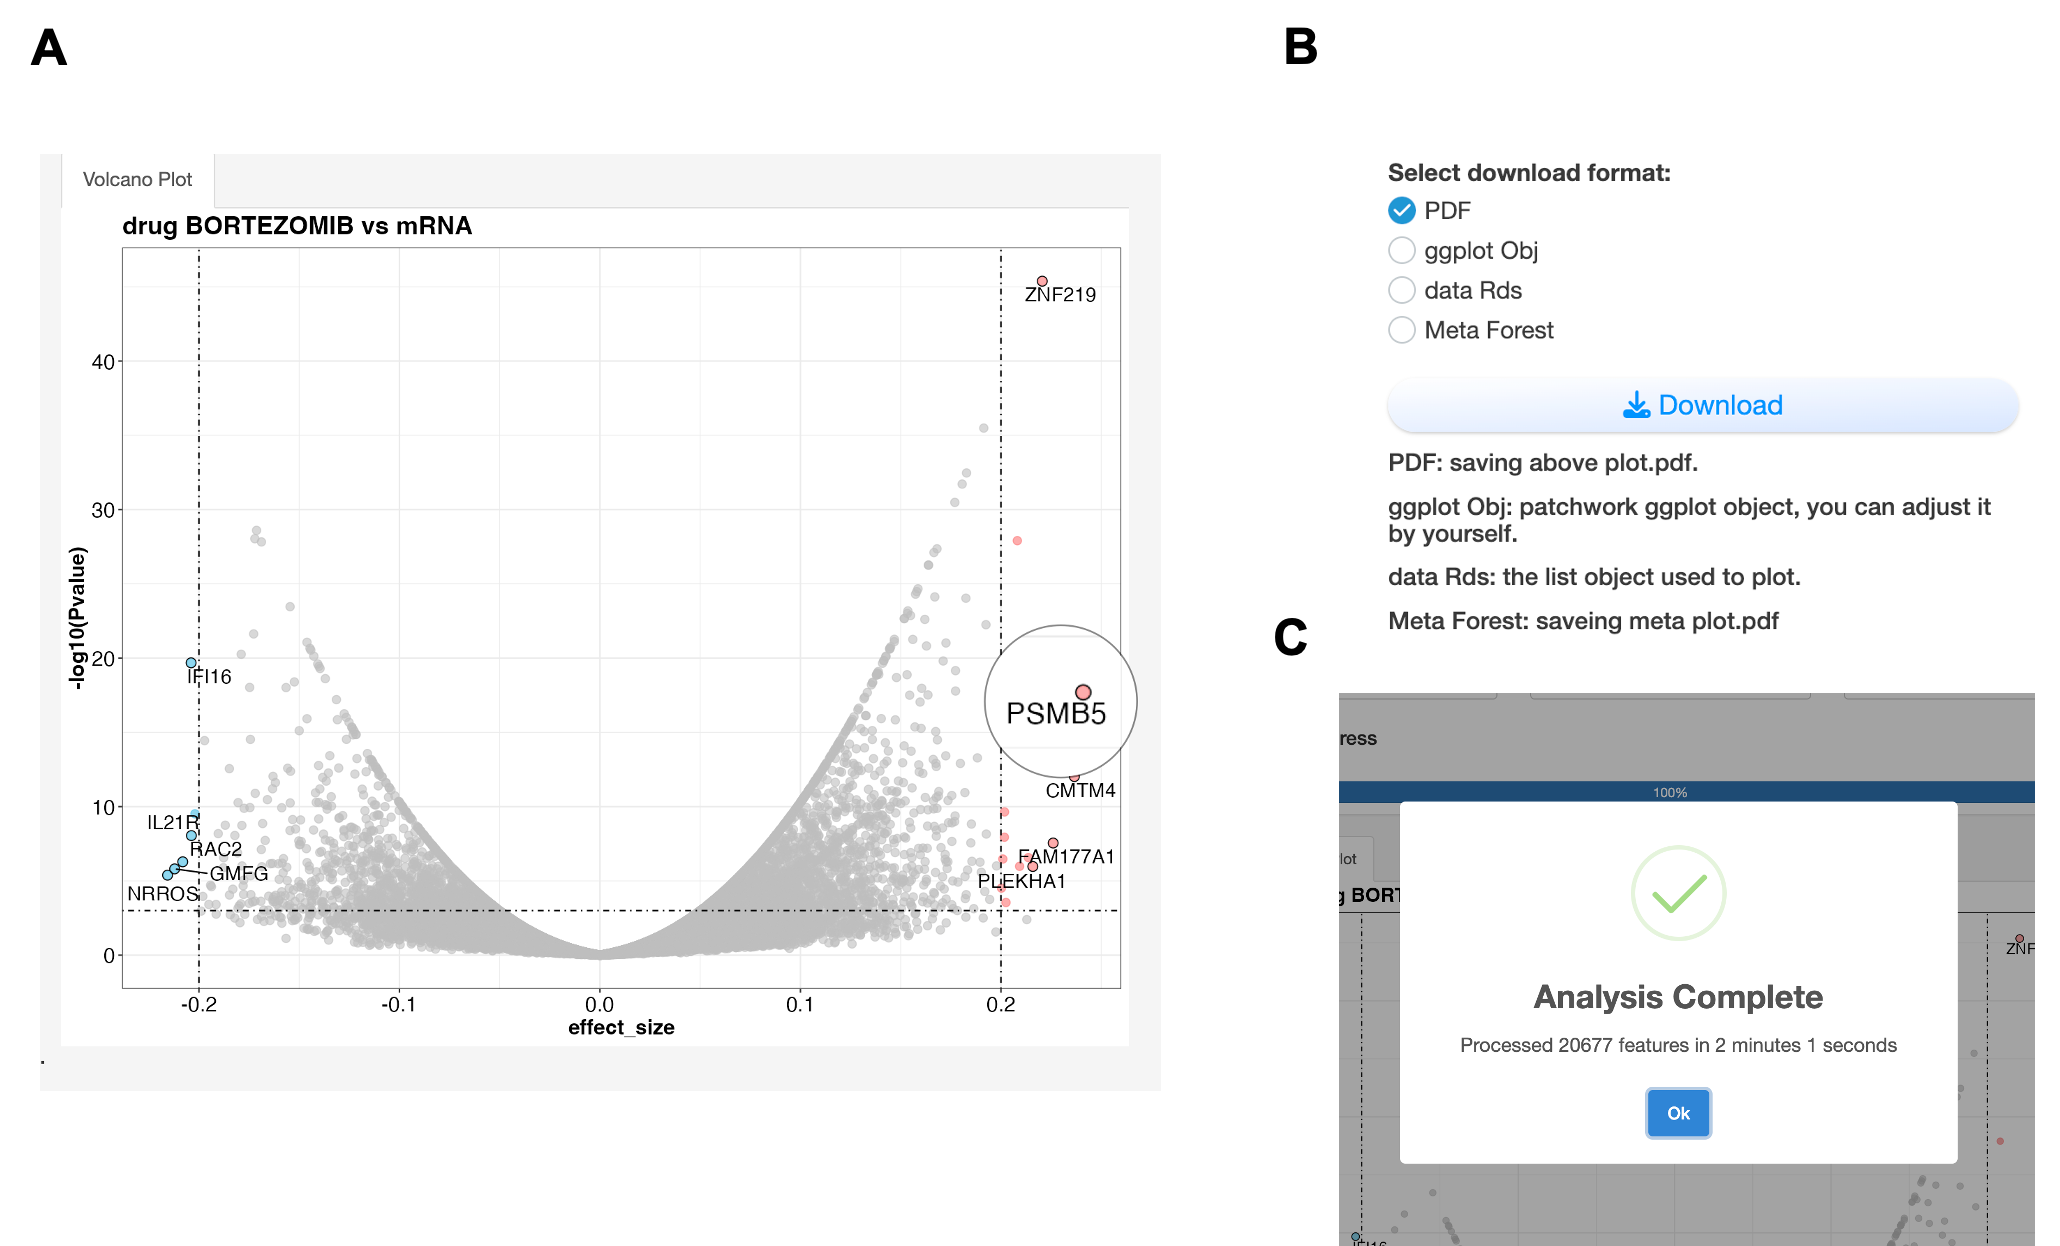
A. Volcano plot showing associations between Bortezomib and mRNA expression. The x-axis represents effect size (strength and direction of association), while the y-axis shows statistical significance (-log10 p-value). Red points indicate significant positive associations (effect size > 0.2, p < 0.001), suggesting resistance markers; blue points show significant negative associations, suggesting sensitivity markers. The effect size is calculated from meta analysis which each feature pairs use different statistic method depends on data type: 1) For continuous vs. continuous features (e.g., drug vs. mRNA): Pearson correlation; 2) For discrete vs. continuous features (e.g., mutation vs. drug), Wilcoxon test; 3) For discrete vs. discrete features (e.g., mutation vs. fusion): Chi-squared test. PSMB5 may server as a potential Bortezomib resistance gene from screen. B. All results are downloadable in various formats (PDF, CSV, R objects) for further analysis. C. A popup window can remind user the completion of analysis.
The DrugFeature module provides users with a comprehensive interface for exploring and analyzing drug sensitivity data across different biological samples in the DROMA database.
Key capabilities of this module include:
Drug Selection: Users can select specific drugs from a searchable dropdown menu to analyze their sensitivity patterns.
Data Filtering: The interface allows filtering by data type (cell lines, PDCs, PDOs, PDXs) and tumor type, enabling focused exploration of specific cancer models.
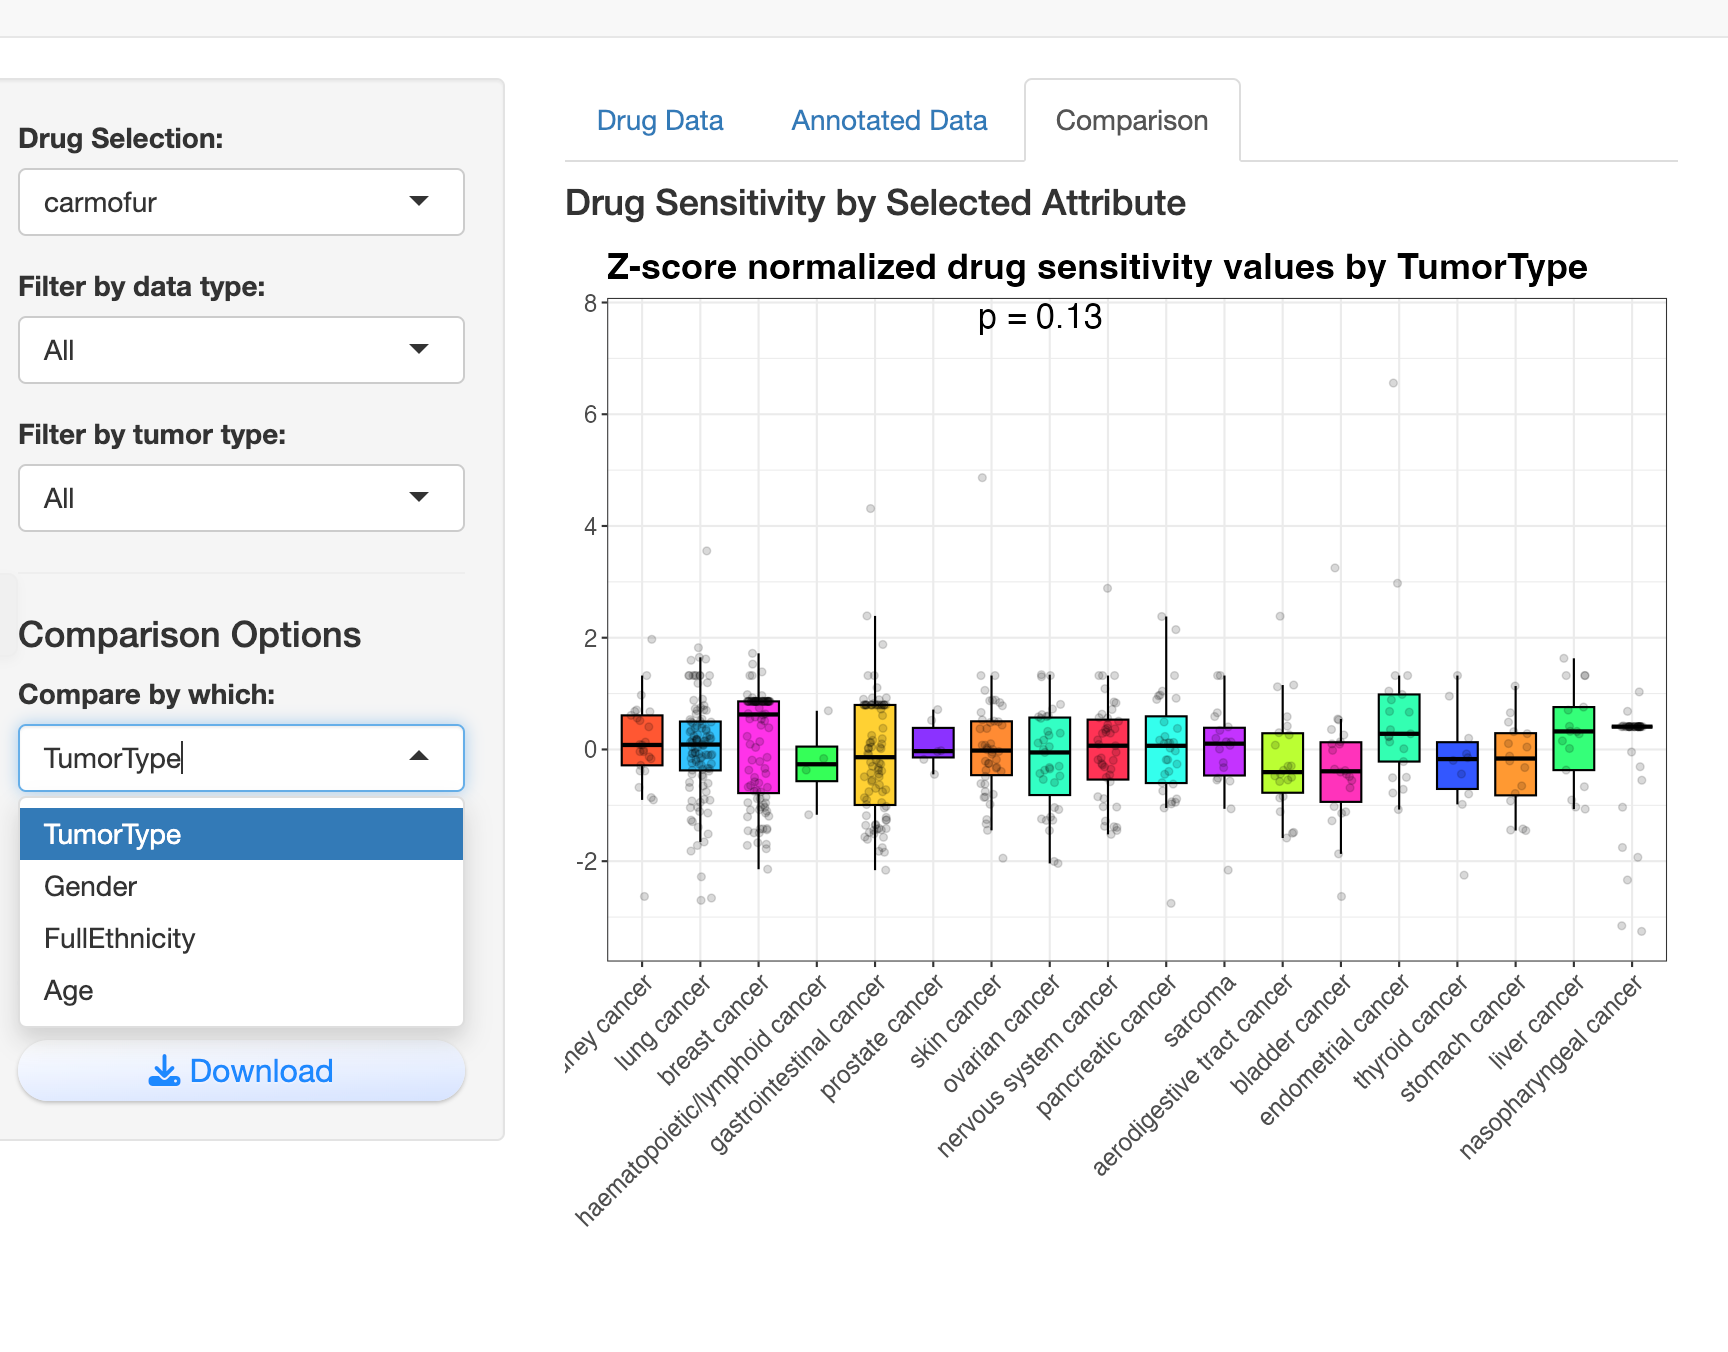
Comparison Analysis: Users can compare drug sensitivity across various biological attributes like tumor type, gender, ethnicity, or age, with visualizations automatically adapting to categorical or continuous variables.
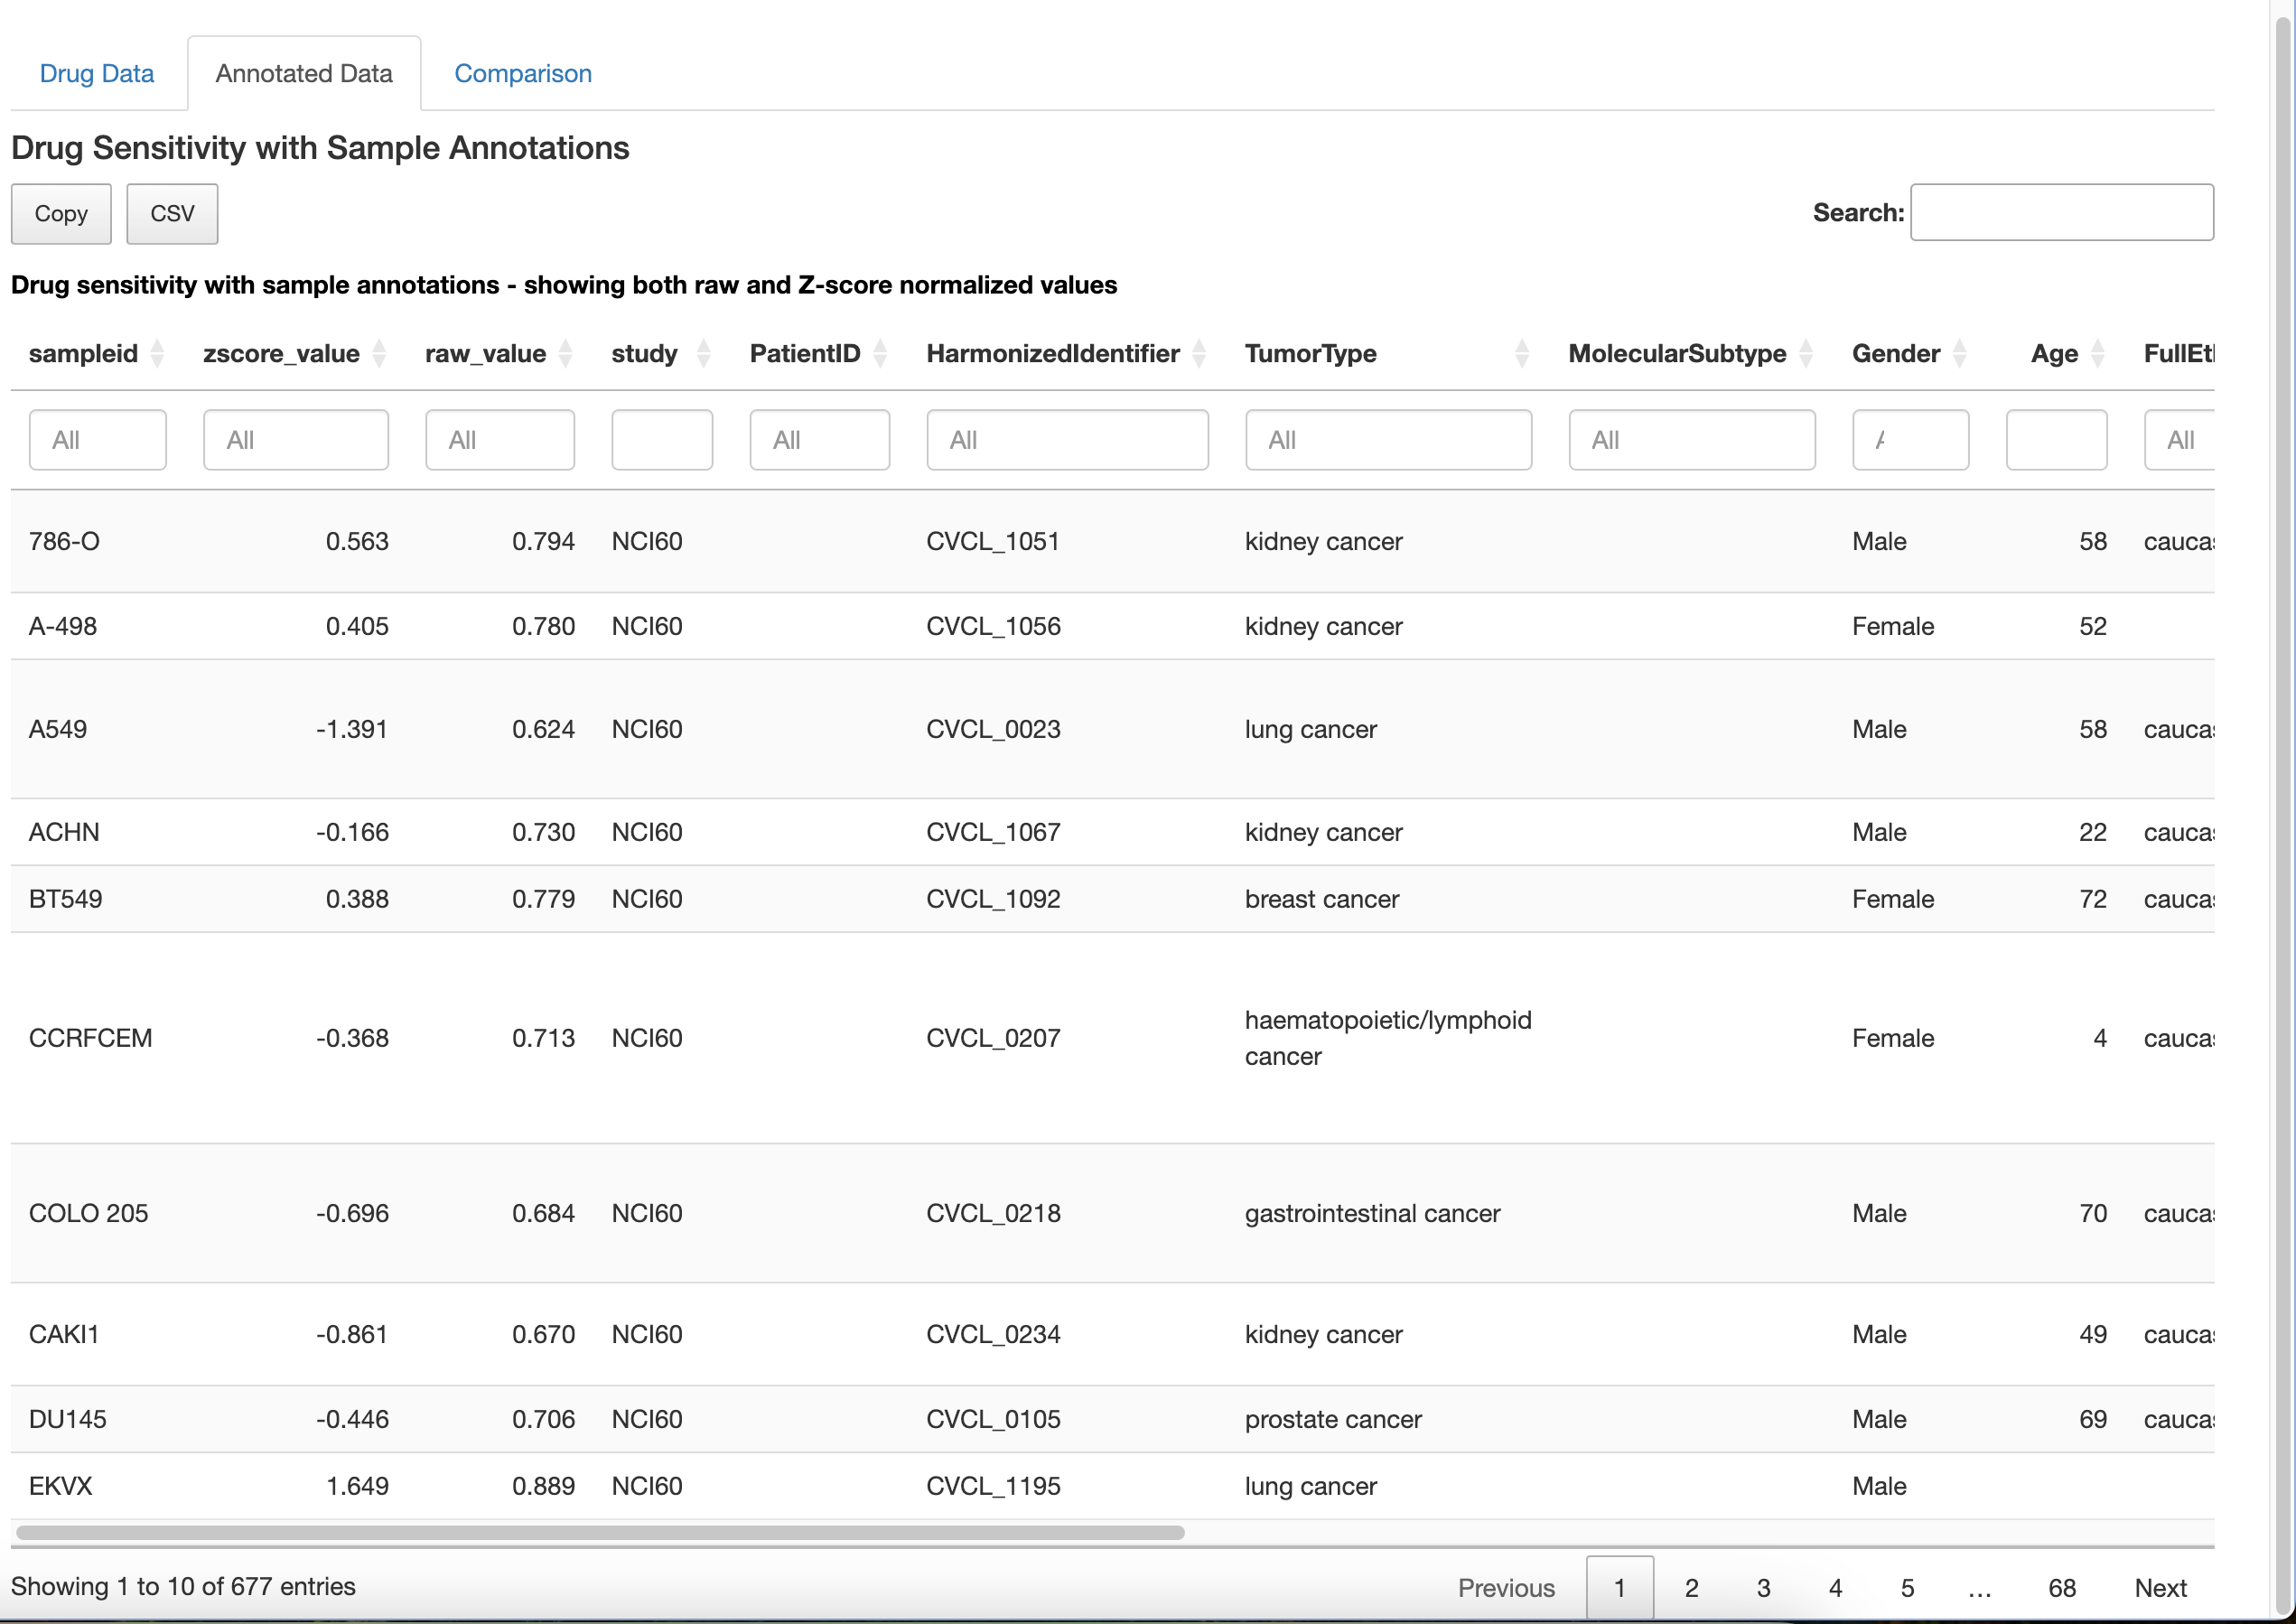
Interactive Tables: The module presents both raw and z-score normalized drug sensitivity data in interactive tables with built-in search, filter, and copy functions.
Data Annotation: It integrates sample annotations with drug sensitivity data, allowing users to explore associations between drug response and sample characteristics.
Visualization: For continuous variables (like age), it generates scatter plots with trend lines and correlation statistics, while for categorical variables (like tumor type), it creates boxplots with statistical comparisons.
Data Export: Users can download the displayed data in multiple formats (RDS or CSV) for further analysis in other tools.
On the left of screen there is a floating widget:
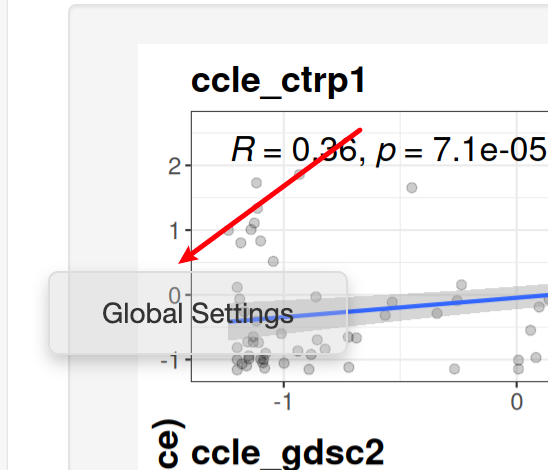
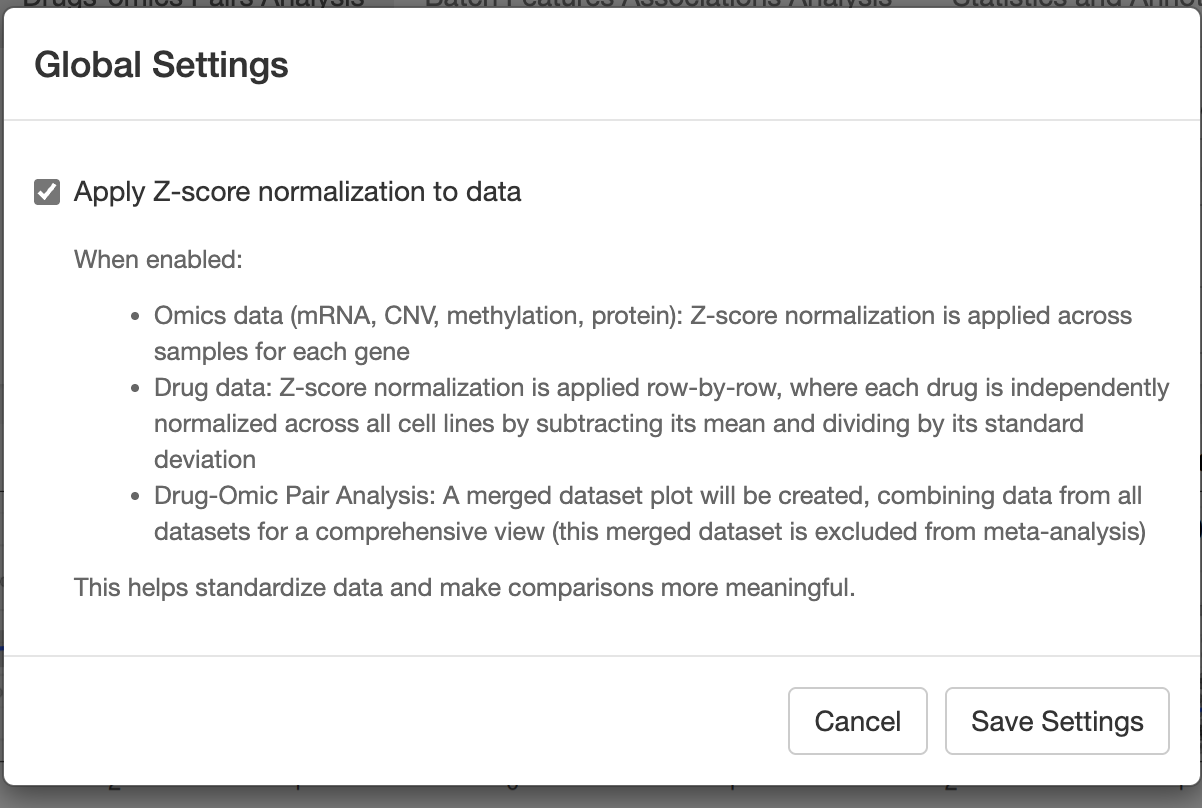
After clicking it, you could do some global settings:
- Drug and sample counts by source
- Data type counts (cell lines, PDC, PDO, PDX)
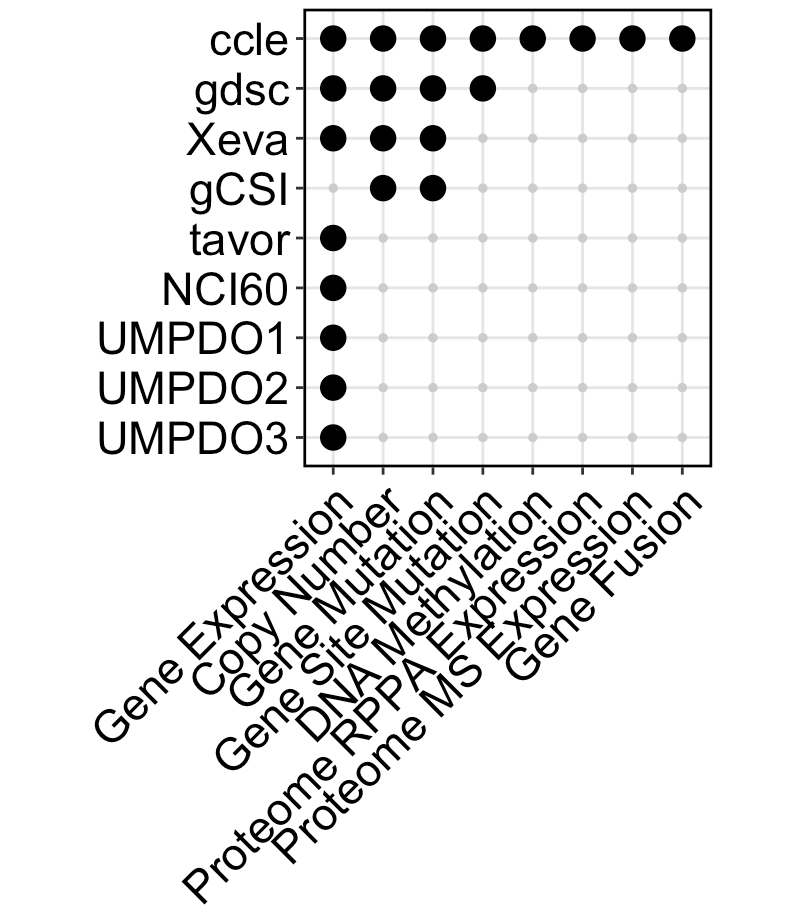
- Molecular characteristics available in each dataset
- Drug and sample overlap between datasets
- Tumor type distribution
Include 17 datasets now(11 cell line, 2 PDC, 3 PDO, 1 PDX), totally 2599 unique samples and 56398 unique drugs.
z-score:
- Omics data (mRNA, CNV, methylation, protein): Z-score normalization is applied across samples for each gene.
- Drug data: Z-score normalization is applied row-by-row, where each drug is independently normalized across all cell lines by subtracting its mean and dividing by its standard deviation.
- Drug-Omic Pair Analysis: A merged dataset plot will be created, combining data from all datasets for a comprehensive view (this merged dataset is excluded from meta-analysis.
drug metrics:
Except gCSI dataset includes AAC(Area above curve), all others use AUC(area under curve).
Following the principle of least change, AAC values from gCSI are rescaled such that a lower metric indicates higher sensitivity across all datasets. (AAC2 = max(AAC) - AAC)
- App.R: Main application file
- Modules/: Contains UI and server components for different application sections
- DrugOmicPair.R: Drug-omics pairs analysis module
- BatchFeature.R: Batch features analysis module
- StatAnno.R: Statistics and annotations module
- LoadData.R: Data loading module
- Preprocess.R: Data preprocessing module
- Package_Function/: Contains core functionality
- FuncGetData.R: Data retrieval functions
- FuncDrugOmicPair.R: Drug-omics pair analysis functions
- FuncBatchFeature.R: Batch feature analysis functions
- Input/: Contains data files
- config.yml: Configuration settings
DROMA-DB integrates data from multiple sources:
- Cell Line Data: CCLE, GDSC, gCSI, CTRP1, CTRP2, PRISM
- Patient-Derived Organoid (PDO) Data: In-house and published datasets
- Annotation Data: Comprehensive annotations for samples and drugs
Feel free to contact us if you find any bugs or have any suggestions:
- Email: yc47680@um.edu.mo
- GitHub: https://github.com/mugpeng
This project is licensed under the MIT License - see the LICENSE file for details.
Refactor App.R and Modules: Update version to 0.3.
- add new datasets, now have in vivo data now(Xeva PDX dataset), totally include 17 datasets now(11 cell line, 2 PDC, 3 PDO, 1 PDX)
- add new module, and enhance drug feature analysis.
- Remove deprecated Rmd files and adjust data loading paths.
- Update BatchFeature and DrugOmicPair modules for improved functionality and user experience.
- Functionize all functions in modules and put them under
Package_Function/preparing for making DROMA R package. - fix some bugs.
I will attend UM PhD seminar, welcome!

The stable version v0.2 is online now in UM network: http://fscpo.fhs.um.edu.mo/DROMA_DB/ Btw, please be patient, it may take 10-20s when first time start it. :)
This update includes:
- Add denglab three PDO data(deng1(breast), deng2(colon), deng3(nasopharynx)) with paired RNAseq, IC50 and annotation data;
- Harmonize cell line drug and cell names also the annotation data;
- Add choice to filter data for a specific tumor type(Breast, lung..) or data type(cell line, PDO), and a global setting page to set data. Now all continous data is transformed to by z-score in default, which allow to add a merged result for visualization ;
- Add several figures and some visualization-related improvement.
gitingest -o gitingest_output/0314.txt -e rsconnect -e Input -e Output -e Log -e Test -e Others -e images -e readme.md -e .DS_Store -e .Rproj.user -e .Rhistory
<div class="row">
    <div class="column" style="float:left;width:75%">
     	   DROMA-DB is a comprehensive database and analysis tool that integrates the largest published studies investigating cancer response to chemical compounds and the associations between drug sensitivity and multi-omics data (mRNA, CNV, protein, mutation, etc.) across various cancer models including PDC (Patient-Derived Cells), PDO (Patient-Derived Organoids), and PDX, human data are under development.
    </div>
    <div class="column" style="float:left;width:25%">
        <img src="http://cos01.mugpeng.top/img/20250310150357.png">
    </div>
</div>