This is the repository for some sample mySQL Yahoo Finance code done using Jupyter on Visual Studio Code.
What I aim to achieve is pull finance API data from Yahoo Finance and visualize the data. I use PandasDB as a visualization tool and am quite lucky that Yahoo Finance is already in Pandas format so no need to convert data.
I also put the data in a mySQL database so that we can build a database so that we do not have to rely on Yahoo Finance for historical data (Though Realtime data still using Yahoo Finance).
This here is an image of AAPL stock from 1980-2023. Here, however, we are not using PandasDB but rather the data that twas inserted into the mySQL database and table is being visualized using a software called PopSQL.
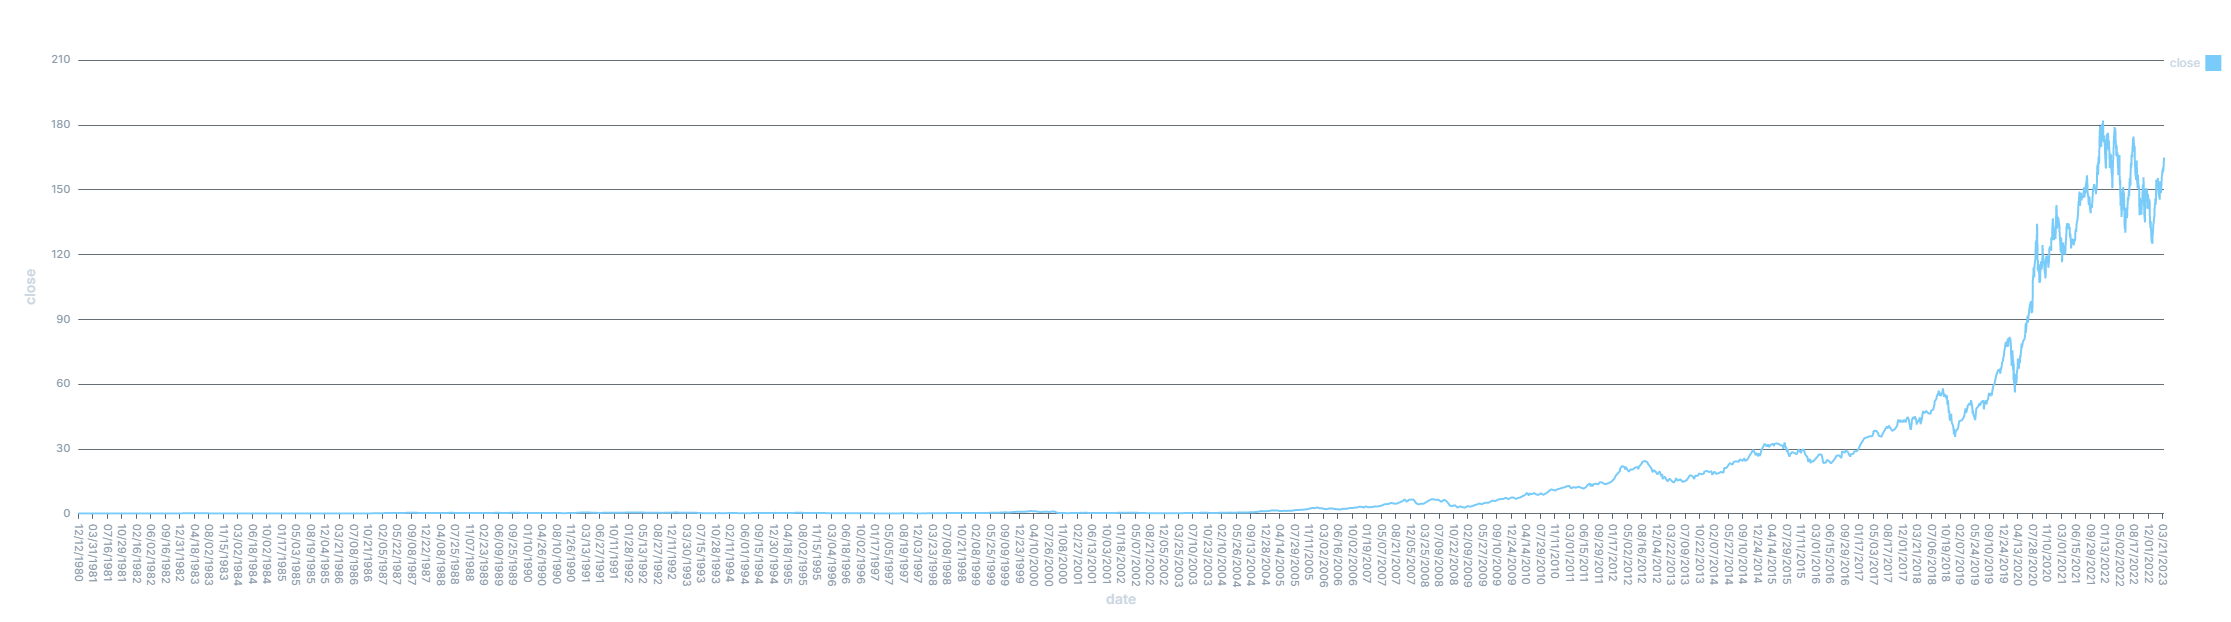
PopSQL is quite handy as it not only allows me to change mySQL database info quite easily, it's intuitive GUI allows me to do so without breaking a sweat. Not only that, it has a built in tool to create graphs and visualize the data and can change the visuals pretty easily. Very intuitive. Although it is easy to use PopSQL to visualize data, I want to visualize the data on my own.
This image shows the AAPL historical stock data inside the mySQL database. It shows the amount of bytes and amount of data inside the database as well.

What the StockInput code does is it:
- Asks for a ticker Symbol
- For example: AAPL, GOOG, M, TM (Apple, Google, Microsoft, Toyota Motor Corp.)
- Asks for a start and end date
- For example: 1980-09-08 & 2023-04-03 (September 8th 1980 to April 3rd 2023)
- Adds it into the mySQL database in a table called stock FYI: If you are using this code, then remember to change the mySQL information
What Stock Visualization does is instead of adding to the mySQL database, it just requests the data from Yahoo Finance and outputs a graph and table. The graph it outputs is the PandasDB chart from above:
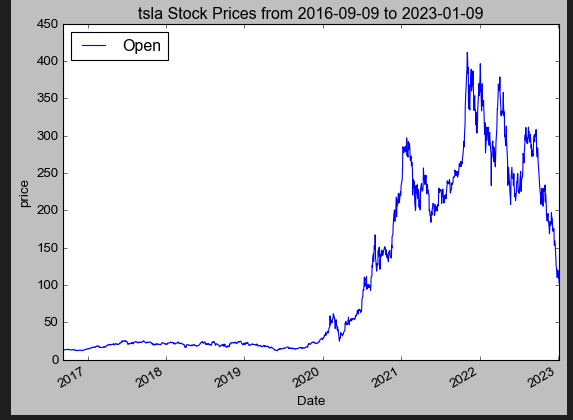
The output of the table is:
[*********************100%***********************]  1 of 1 completed
                                 Open        High         Low       Close  \
Datetime
2023-03-31 09:30:00-04:00  162.440002  162.550003  161.910004  162.520004
2023-03-31 09:31:00-04:00  162.520004  162.600006  162.380005  162.410004
2023-03-31 09:32:00-04:00  162.410004  162.500000  162.210007  162.490005
2023-03-31 09:33:00-04:00  162.500000  162.764999  162.470001  162.690002
2023-03-31 09:34:00-04:00  162.699997  163.029999  162.699997  163.020004
...                               ...         ...         ...         ...
2023-03-31 15:55:00-04:00  164.660004  165.000000  164.660004  164.919998
2023-03-31 15:56:00-04:00  164.919998  164.970001  164.860001  164.934998
2023-03-31 15:57:00-04:00  164.940002  164.940002  164.809998  164.889999
2023-03-31 15:58:00-04:00  164.889999  164.970001  164.809998  164.940002
2023-03-31 15:59:00-04:00  164.940002  165.000000  164.699997  164.839996

                            Adj Close   Volume
Datetime
2023-03-31 09:30:00-04:00  162.520004  1514404
2023-03-31 09:31:00-04:00  162.410004   207438
2023-03-31 09:32:00-04:00  162.490005   199147
2023-03-31 09:33:00-04:00  162.690002   260253
2023-03-31 09:34:00-04:00  163.020004   395121
...                               ...      ...
2023-03-31 15:55:00-04:00  164.919998  1047744
2023-03-31 15:56:00-04:00  164.934998   662830
2023-03-31 15:57:00-04:00  164.889999   618646
2023-03-31 15:58:00-04:00  164.940002   895679
2023-03-31 15:59:00-04:00  164.839996  2330398

[390 rows x 6 columns]
mydb = mysql.connector.connect(
  host="localhost",
  user="root",
  password="Saitanujk1234",
  database="Cyan"
)
In this code, remember host is the localhost if you are hosting the mySQL database on your computer, user is usually root if you did not change it. Enter your password and the name of the database that you are making changes to.