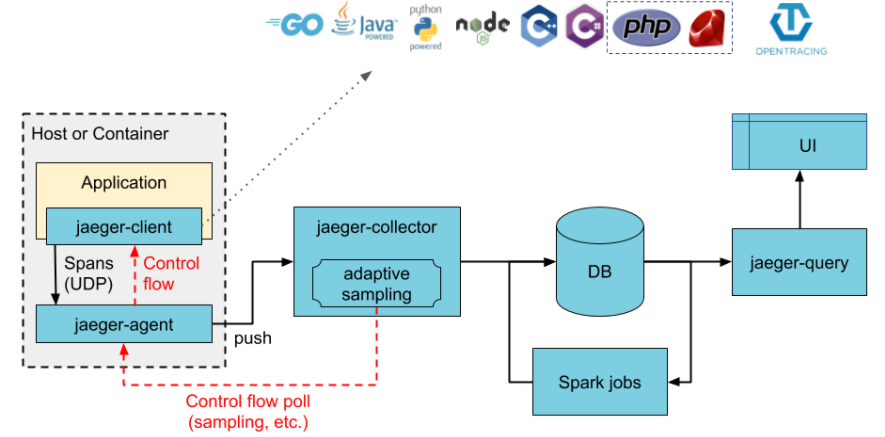
An explanation of the different components of what we will add to do monitoring
- Agent – A network daemon that listens for intervals sent via the application's DAO.
- Client – The component that implements the OpenTracing API for distributed tracing.
- Collector – The component that receives the extents and adds them to a queue for processing.
- Console – A user interface that allows users to view their distributed tracing data.
- Query – A service that retrieves traces from storage.
- Span – The logical unit of work in Jaeger, which includes the name, start time and duration of the operation.
- Trace – The way Jaeger presents execution requests. A trace consists of at least one range.
<dependency>
      <groupId>io.quarkus</groupId>
      <artifactId>quarkus-smallrye-opentracing</artifactId>
</dependency>In the : src/main/resources/application.yml, we add this :
quarkus:
  jaeger:
    service-name: doodle
    sampler-type: const
    sampler-param: 1
  log:
    console:
format: '%d{HH:mm:ss} %-5p traceId=%X{traceId}, parentId=%X{parentId}, spanId=%X{spanId}, sampled=%X{sampled} [%c{2.}] (%t) %s%e%n'- For the first parameter, if the service-name parameter is not provided, a no-op tracer will be configured, which will result in no tracing data being reported to the backend.
- Second, a constant sampler is used.
- Third, sampler-param is used to set the sampling of the requests. Here there is a sampling of all the queries as it is set to 1. This parameter can go from 0 to 1.
- And finally, we add trace IDs in the log message.
To launch Jaeger (in docker) simply run :
$ docker run -p 5775:5775/udp -p 6831:6831/udp -p 6832:6832/udp -p 5778:5778 -p 16686:16686 -p 14268:14268 jaegertracing/all-in-one:latestFinally go to: http://localhost:16686/ to open the Jaeger UI
Once we have configured and started Jaeger, we need to launch the application:
- In the doodle/api file, execute :
$ docker-compose up -dthen,
$ ./mvnw compile quarkus:dev- In the doodle/front file, execute :
$ npm installthen,
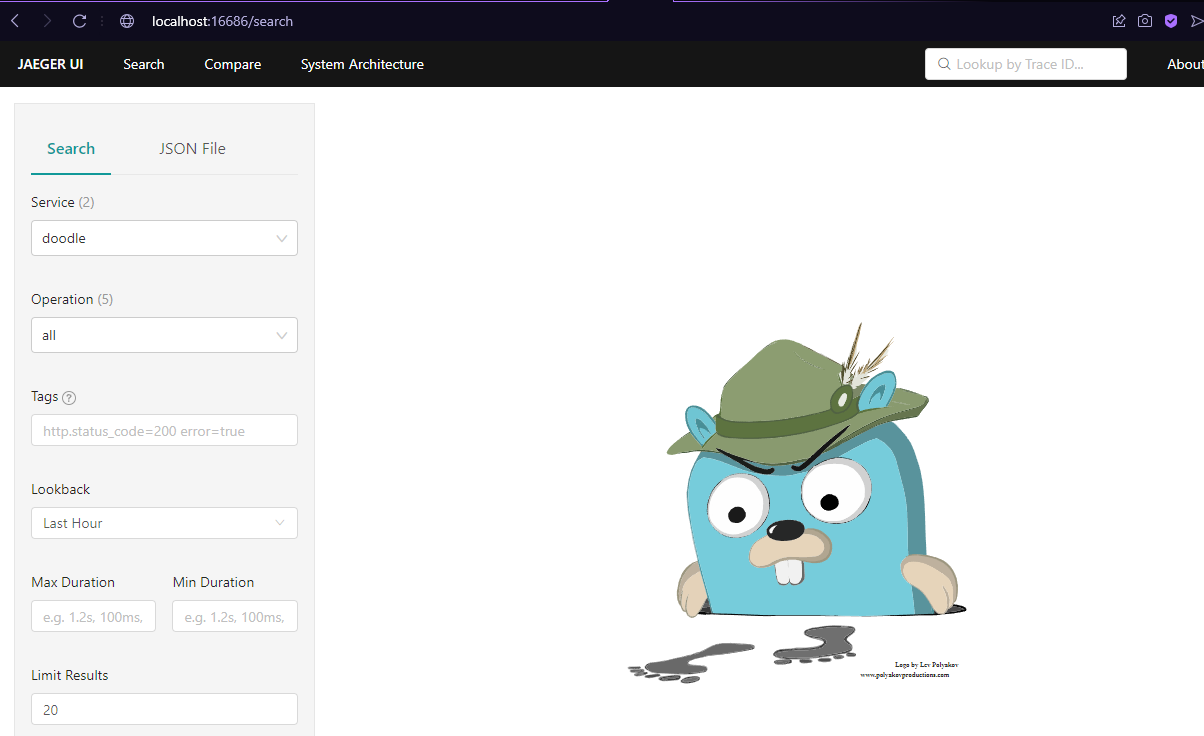
$ npm startAt the address: http://localhost:16686/, we have the graphical interface of Jaeger, to visualize distributed tracing with it:
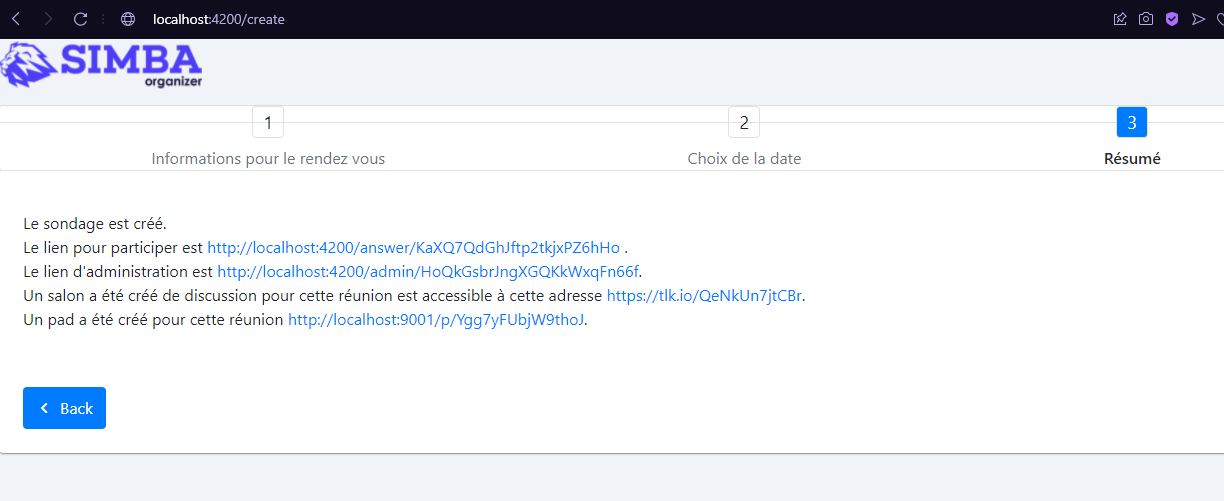
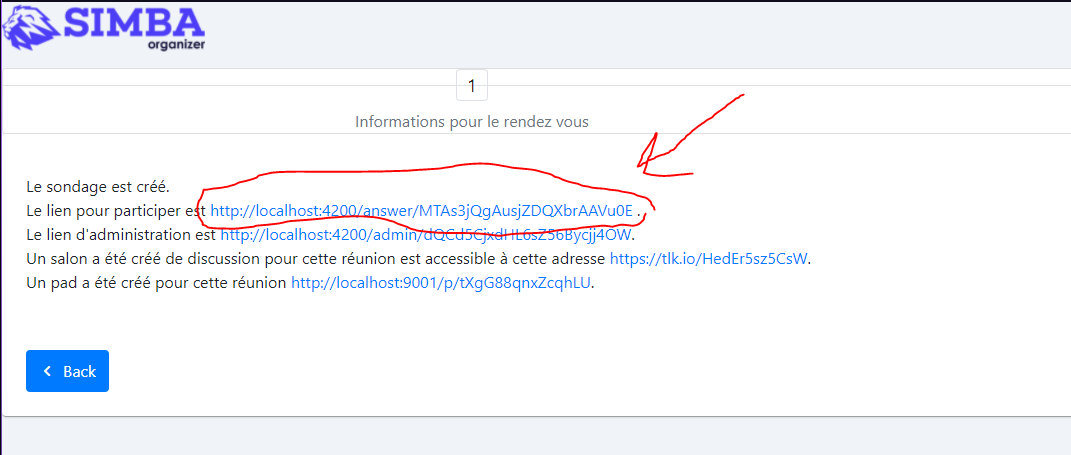
Creation of our poll :
Results on Jaeger :
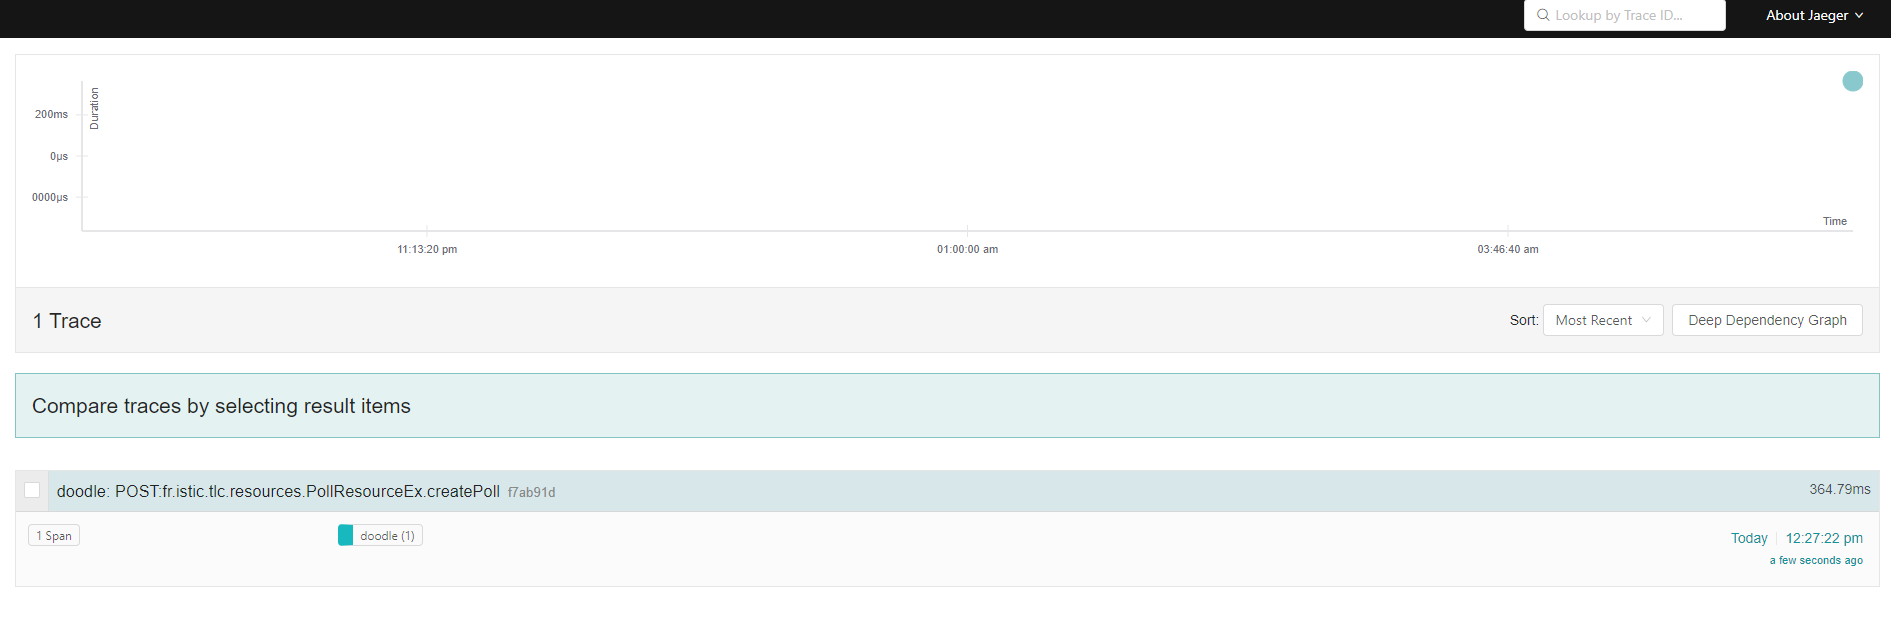 The dot at the top tells us the time the request was made and its duration (time to response). We can click on its trace to learn more.
Distributed tracing is a technique that is used to tie the information about different units of work together—usually executed in different processes or hosts—in order to understand a whole chain of events in a distributed transaction. Tracing lets us visualize, in our case with doodle, call flows in this service oriented architectures. It can be invaluable in understanding serialization, parallelism, and sources of latency.
The dot at the top tells us the time the request was made and its duration (time to response). We can click on its trace to learn more.
Distributed tracing is a technique that is used to tie the information about different units of work together—usually executed in different processes or hosts—in order to understand a whole chain of events in a distributed transaction. Tracing lets us visualize, in our case with doodle, call flows in this service oriented architectures. It can be invaluable in understanding serialization, parallelism, and sources of latency.
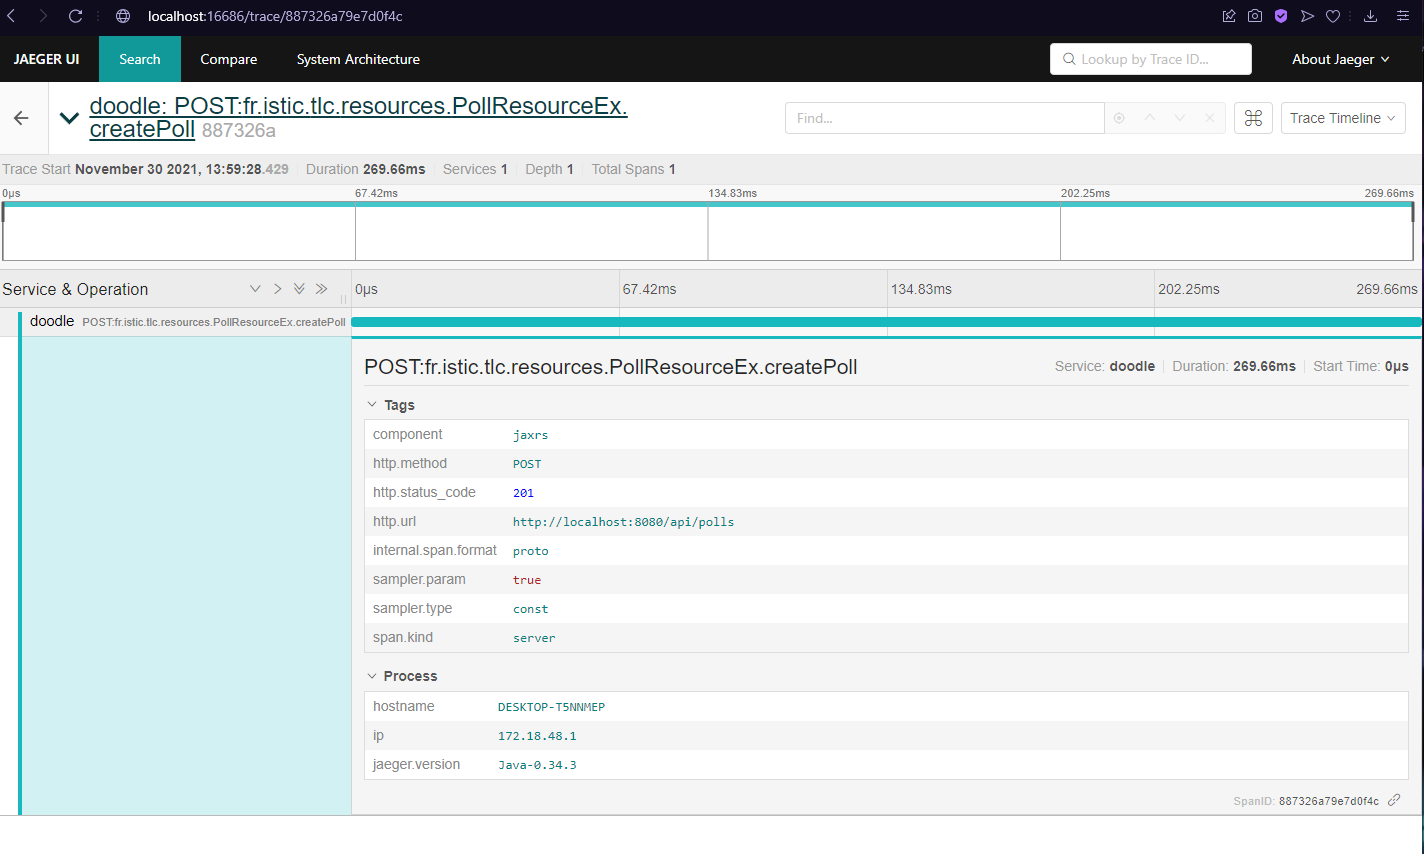 Here we can see the HTTP method (POST), the response obtained (201), the URL... In the name of the trace we can also see which method of which class was called.
Jaeger records the execution of individual requests across the whole stack of microservices, and presents them as traces. A trace is a data/execution path through the system. An end-to-end trace is comprised of one or more spans.
Here we can see the HTTP method (POST), the response obtained (201), the URL... In the name of the trace we can also see which method of which class was called.
Jaeger records the execution of individual requests across the whole stack of microservices, and presents them as traces. A trace is a data/execution path through the system. An end-to-end trace is comprised of one or more spans.
A span represents a logical unit of work in Jaeger that has an operation name, the start time of the operation, and the duration. Spans may be nested and ordered to model causal relationships.
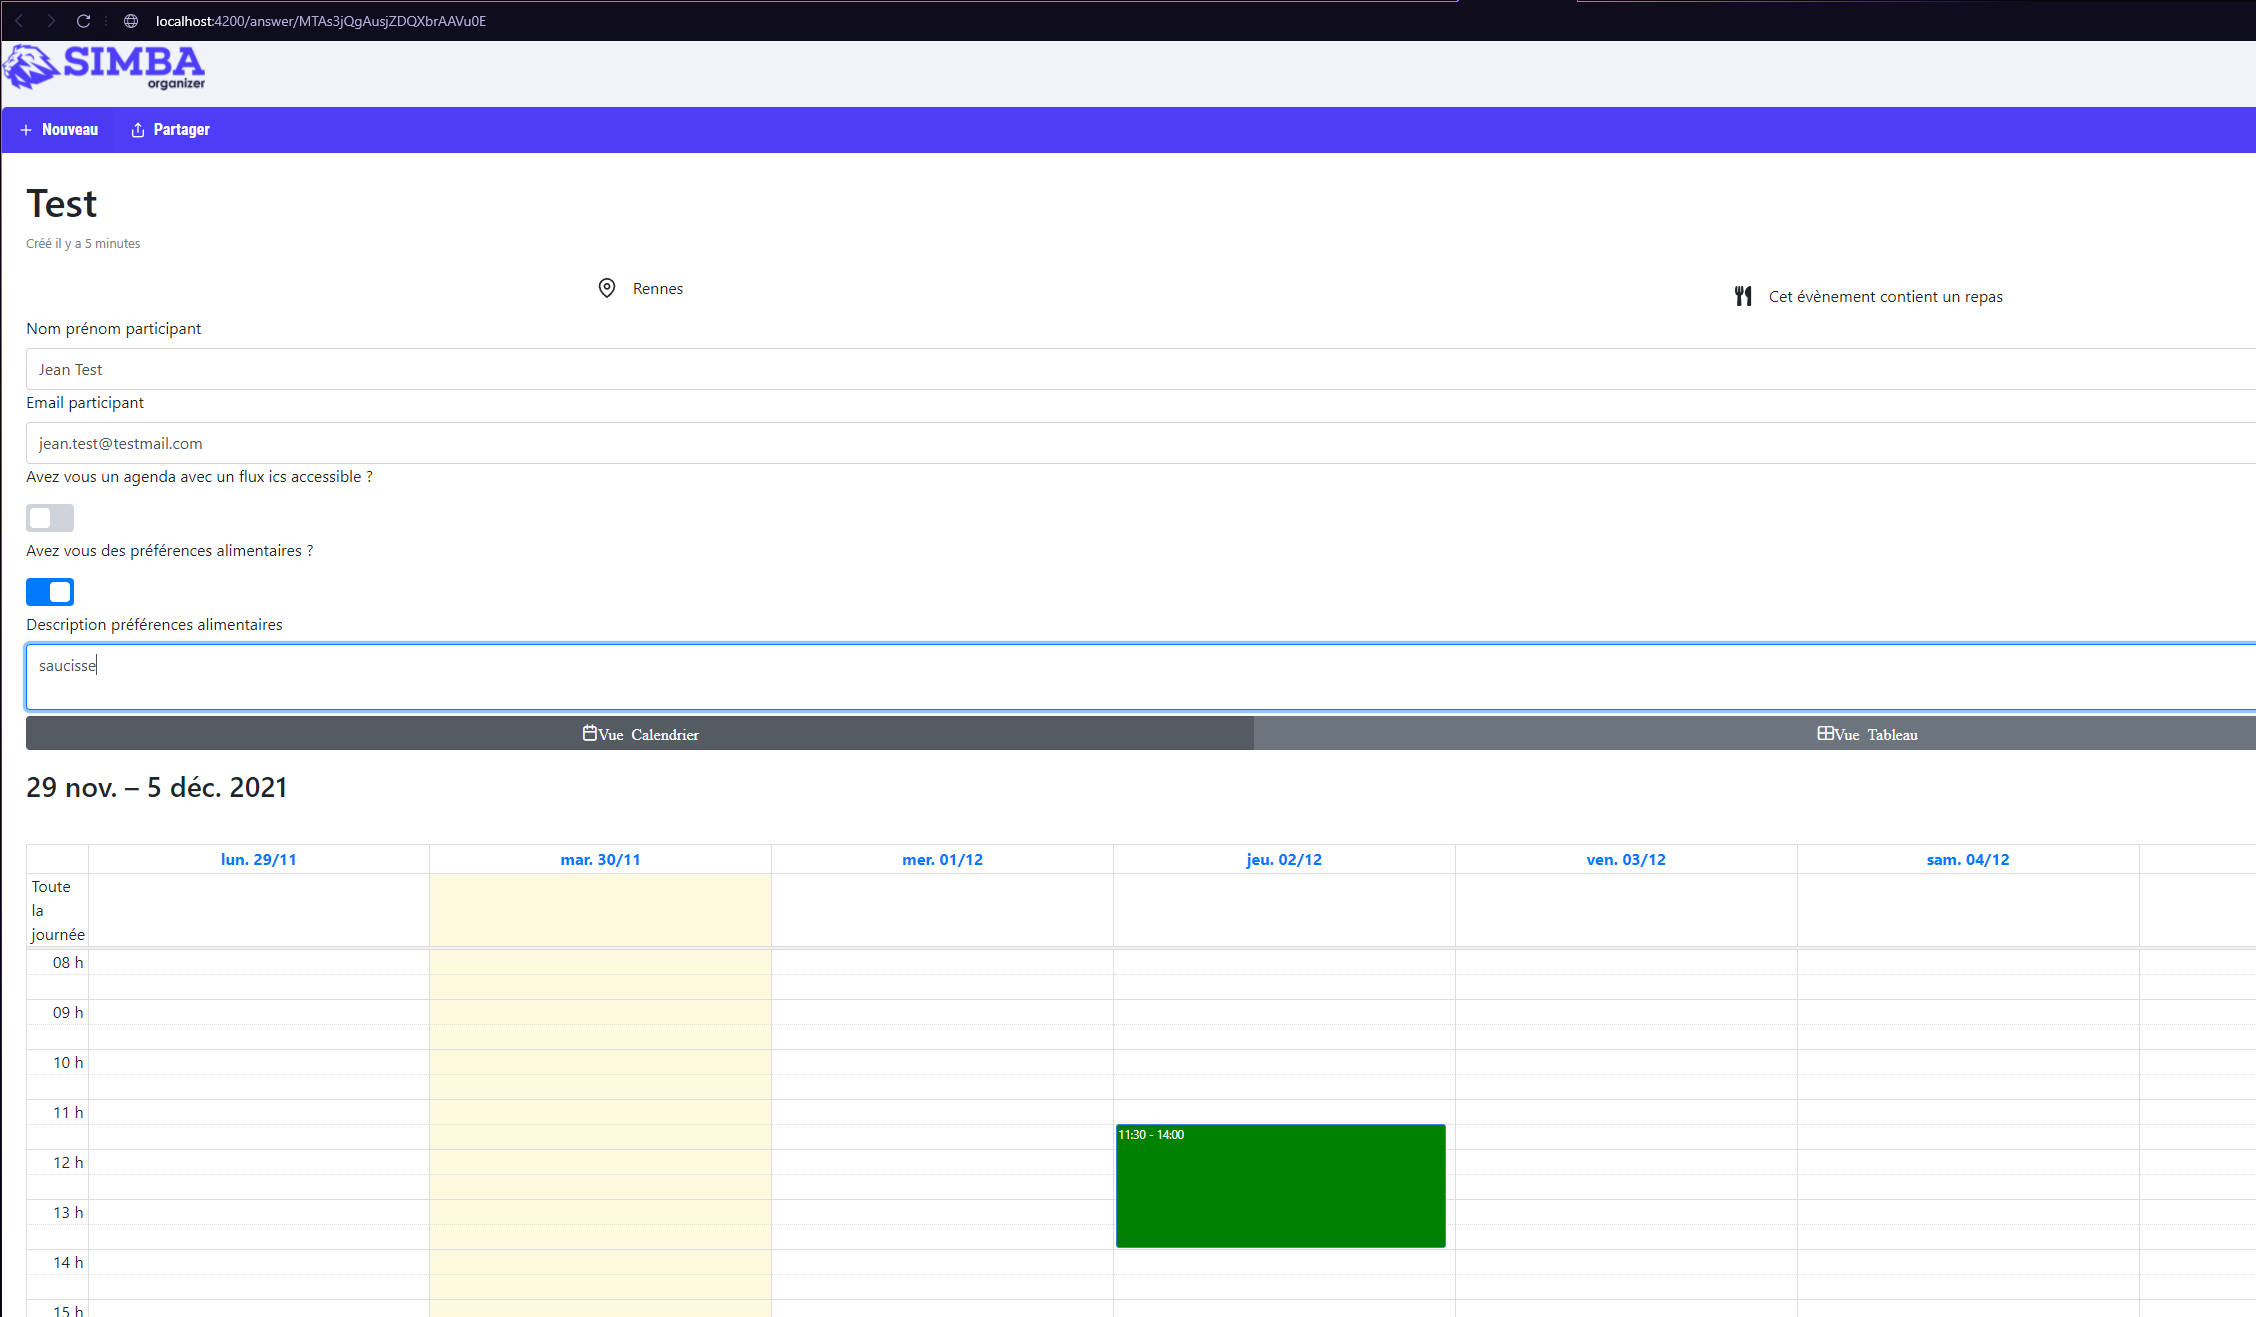
Now we can try to create a meeting participant :
Observability : All Jaeger backend components expose Prometheus metrics by default (other metrics backends are also supported). Logs are written to standard out using the structured logging library zap.
High Scalability: Jaeger backend is designed to have no single points of failure and to scale with the business needs. For example, any given Jaeger installation at Uber is typically processing several billions of spans per day.
We click to participate and fill in the fields, then we submit :
Now we have new traces in Jaeger (2 GET and 1 POST) that will be used to create the participant :
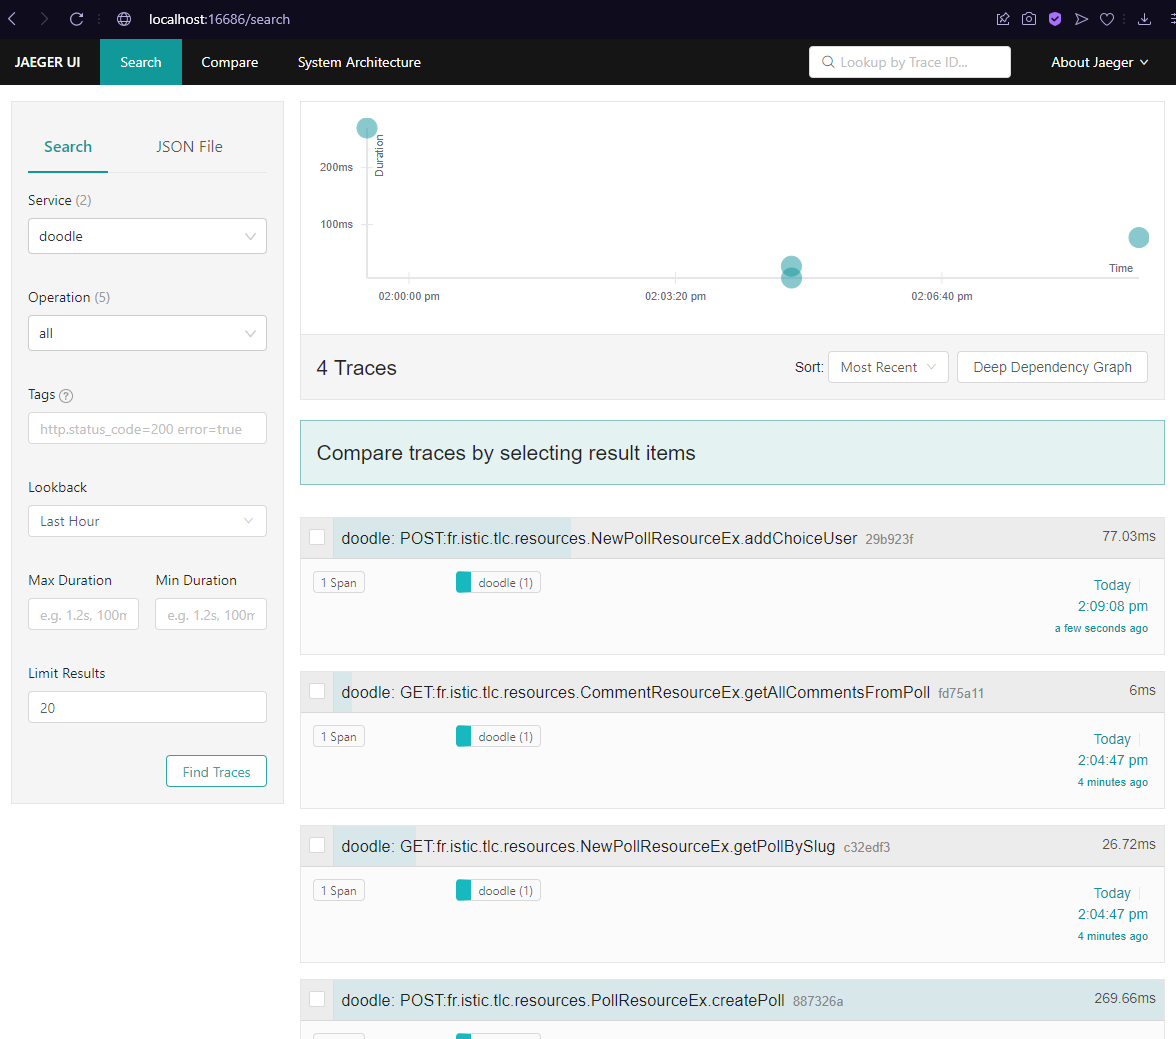
As for the old trace we can click to have all the information on these requests.
And arriving at this point,to finish, we can also say that for the logging, Jaeger components only log to standard out, using structured logging library configured to write log lines as JSON encoded strings.
To add , the logging system records discrete events. For example, you can use the debug information or error messages of applications to troubleshoot issues.