This guide tells how to connect to Aleo Community Dashboard
The guide is ONLY for those who run Aleo miners
For more information on Telegraf and Grafana see https://github.com/stakeconomy/solanamonitoring/blob/main/README.md
First of all, you need to have Aleo node installed.
Check your miner healt status (very thanks to Nodes.Guru team for the script):
wget -O aleo_monitor.sh https://api.nodes.guru/aleo_monitor.sh && chmod +x aleo_monitor.sh && ./aleo_monitor.sh localhost
Once you have the miner on your server, proceed with the following instructions:
# install telegraf
cat <<EOF | sudo tee /etc/apt/sources.list.d/influxdata.list
deb https://repos.influxdata.com/ubuntu bionic stable
EOF

sudo curl -sL https://repos.influxdata.com/influxdb.key | sudo apt-key add -

sudo apt-get update
sudo apt-get -y install telegraf jq bc

# make the telegraf user sudo and adm to be able to execute scripts as sol user
sudo adduser telegraf sudo
sudo adduser telegraf adm
sudo -- bash -c 'echo "telegraf ALL=(ALL) NOPASSWD:ALL" >> /etc/sudoers'

sudo cp /etc/telegraf/telegraf.conf /etc/telegraf/telegraf.conf.orig
sudo rm -rf /etc/telegraf/telegraf.conf
Create file /etc/telegraf/telegraf.conf
touch /etc/telegraf/telegraf.conf
In file past the text below . Change your hostname
# Global Agent Configuration
[agent]
  hostname = "YOUR HOST NAME" # set this to a name you want to identify your node in the grafana dashboard
  flush_interval = "15s"
  interval = "15s"

# Input Plugins
[[inputs.cpu]]
    percpu = true
    totalcpu = true
    collect_cpu_time = false
    report_active = false
[[inputs.disk]]
    ignore_fs = ["devtmpfs", "devfs"]
[[inputs.io]]
[[inputs.mem]]
[[inputs.net]]
[[inputs.system]]
[[inputs.swap]]
[[inputs.netstat]]
[[inputs.processes]]
[[inputs.kernel]]
[[inputs.diskio]]

# Output Plugin InfluxDB
[[outputs.influxdb]]
  database = "telegraf"
  urls = [ "http://194.163.131.85:8086" ] # keep this to send all your metrics to the community dashboard otherwise use http://yourownmonitoringnode:8086
  username = "telegraf" # keep both values if you use the community dashboard
  password = "RB6b6pcqrKTP"

[[inputs.exec]]
#  ## override the default metric name of "exec"
  name_override = "connections"
  commands = ["sudo su -c /root/aleoscipt/getconnection.sh  -s /bin/bash root"]
  interval = "1m"
  timeout = "1m"
  data_format = "value"
  data_type = "integer" # required

 [[inputs.exec]]
  name_override = "blockheight"
  commands = ["sudo su -c /root/aleoscipt/getheight.sh   -s /bin/bash root"]
  interval = "1m"
  timeout = "1m"
  data_format = "value"
  data_type = "integer" # required

 [[inputs.exec]]
  name_override = "minedcounter"
  commands = ["sudo su -c /root/aleoscipt/getmindeblocks.sh   -s /bin/bash root"]
  interval = "1m"
  timeout = "1m"
  data_format = "value"
  data_type = "integer" # required

 [[inputs.exec]]
  name_override = "getversion"
  commands = ["sudo su -c /root/aleoscipt/getversion.sh   -s /bin/bash root"]
  interval = "1m"
  timeout = "1m"
  data_format = "value"
  data_type = "string" # required
Create folder (if you are a root user)
mkdir /root/aleoscipt
cd /root/aleoscipt
Create bash scripts
touch /root/aleoscipt/getconnection.sh
touch /root/aleoscipt/getheight.sh
touch /root/aleoscipt/getmindeblocks.sh
touch /root/aleoscipt/getversion.sh
Give them execution permission
chmod +x /root/aleoscipt/getconnection.sh
chmod +x /root/aleoscipt/getheight.sh
chmod +x /root/aleoscipt/getmindeblocks.sh
chmod +x /root/aleoscipt/getversion.sh
Edit getconnection.sh
nano /root/aleoscipt/getconnection.sh
Past following text in getconnection.sh file
#!/bin/bash

curl -s --data-binary '{"jsonrpc": "2.0", "id":"documentation", "method": "getconnectioncount", "params": [] }' -H 'content-type: application/json' http://localhost:3030/ | jq '.result?'
Edit getheight.sh
nano getheight.sh
Past following text in getheight.sh file
#!/bin/bash

curl -s --data-binary '{"jsonrpc": "2.0", "id":"documentation", "method": "getblockcount", "params": [] }' -H 'content-type: application/json' http://localhost:3030/ | jq '.result?';
Edit getmindeblocks.sh
nano getmindeblocks.sh
Past following text in getmindeblocks.sh file
#!/bin/bash

curl -s --data-binary '{"jsonrpc": "2.0", "id":"documentation", "method": "getnodestats", "params": [] }' -H 'content-type: application/json' http://localhost:3030/ | jq '.[].misc?.blocks_mined?'
Edit getversion.sh
nano getversion.sh
Past following text in getversion.sh file
#!/bin/bash

/root/.cargo/bin/snarkos --help | grep -o '[0-9]*\.[0-9]*\.[0-9]*'
sudo systemctl enable --now telegraf
sudo systemctl is-enabled telegraf

sudo systemctl restart telegraf
systemctl status telegraf
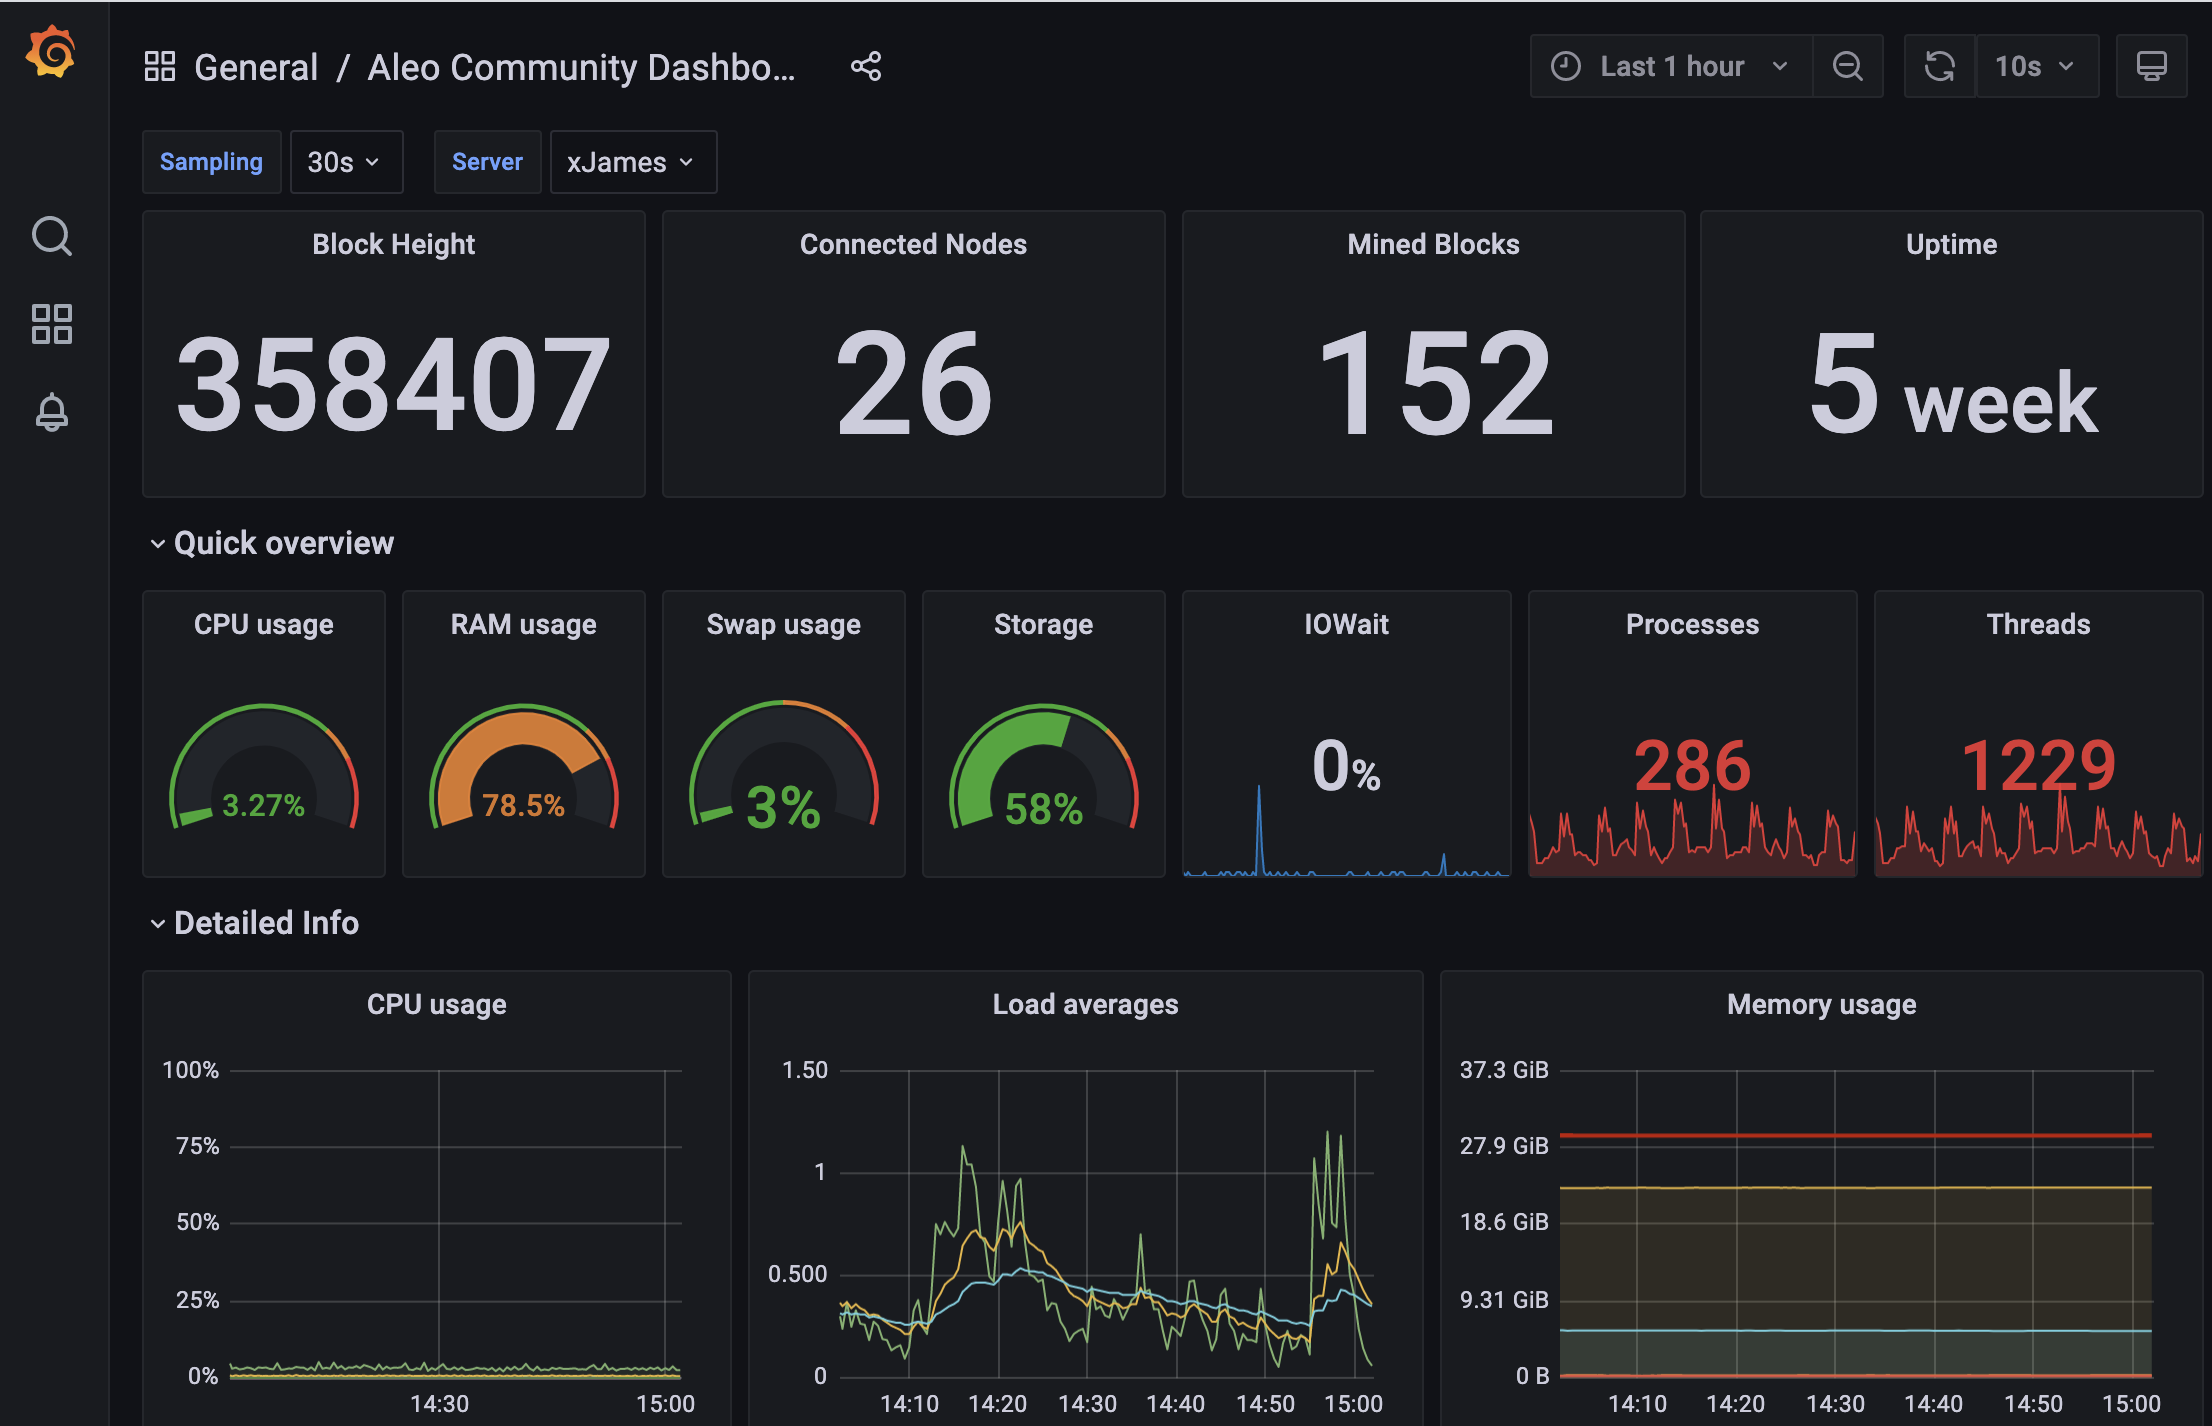
Now everything is ready. Check your node here
You need to find it by name in drop down menu at the top of a page