Add statistics graph #16
Description
Similar to Touhou Heardle, the graph should show the amount of wins vs the degree of guesses (ranging from 1-6). An additional "X" on the x-axis would show the amount of losses (instead of wins).
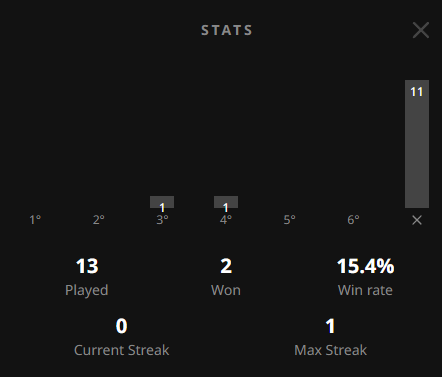
(Example of the statistics graph from Touhou Heardle)
Here, there were 11 losses (i.e., unfinished days or finished days without any correct guesses), and 2 correct days, one of which was done in 3 guesses and the other in 4.