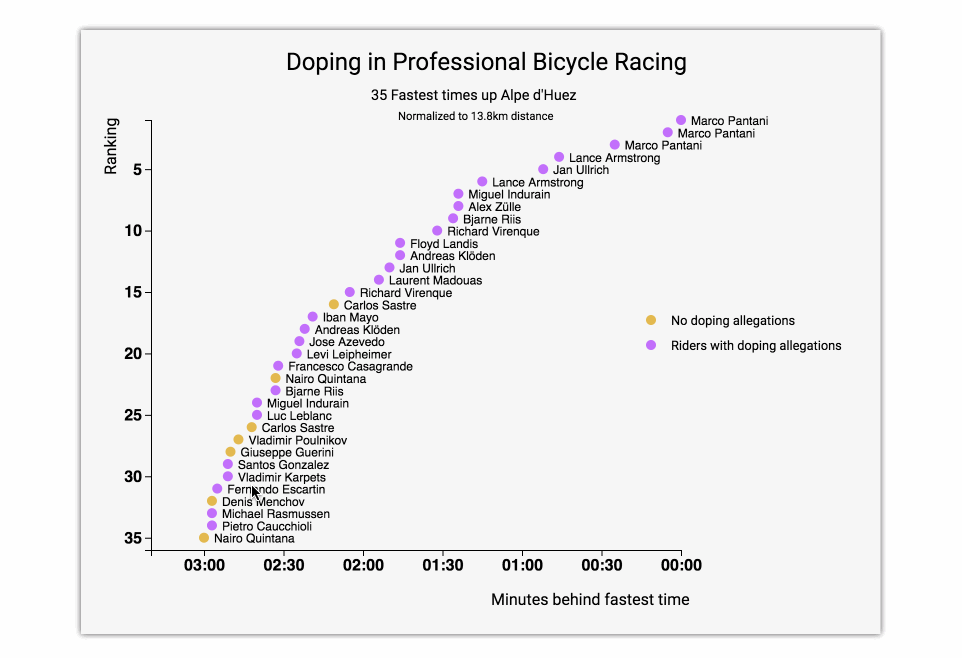
Build a scatterplot that is functionall similart to this.
- I can see performance time visualized in a scatterplot graph.
- I can mouse over a plot to see a tooltip with additional details.
Screenshot of my project:
Build a scatterplot that is functionall similart to this.
Screenshot of my project: