Summary
Chronos is a service written in Rust that ingests messages from a queue and republishes them at some point in the future.
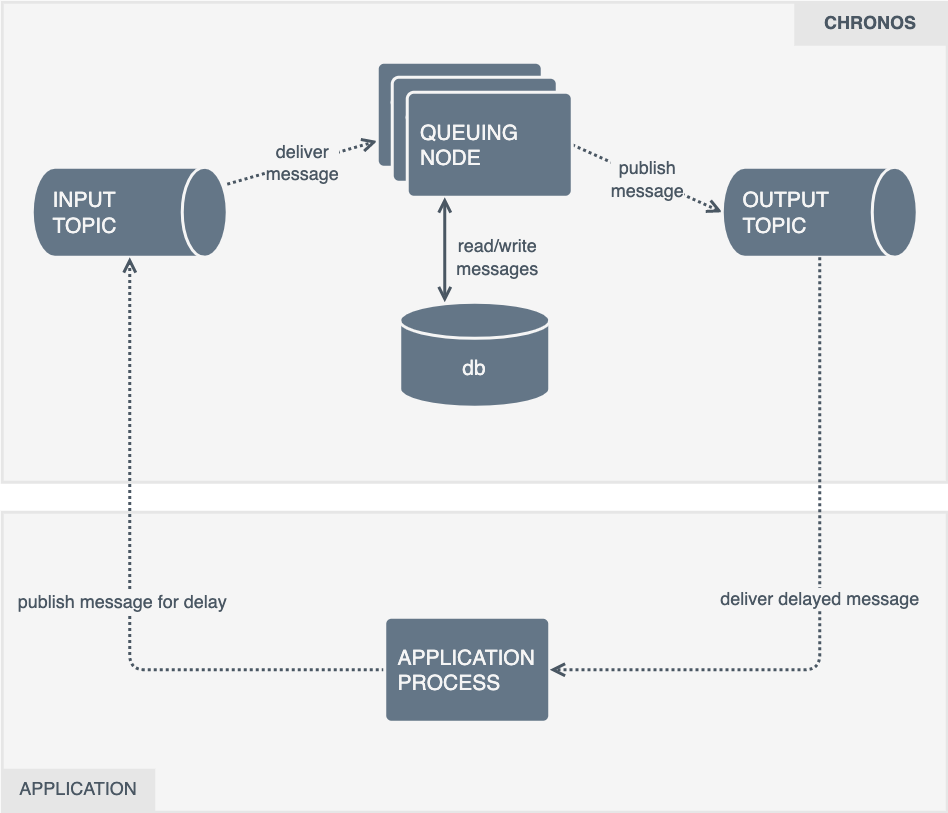
Clients provide a timestamp of when they would like the message re-published. The message is typically stored in a database until the timestamp rolls around, where it's then placed onto the output queue.
To increase throughput, distributed compute resources, and to remove a single point of failure, multiple replicas are run.
Because the Chronos workers are distributed, there are additional locking and error handling primitives built in to detect when other instances have failed to deliver a message.
When it is performing correctly we expect;
- That message we put onto the input queue end up on the output queue
- Messages are fired as close to the clients provided timestamp as possible (the SLA specifies that the p99 of message output jitter should be less than 500ms)
This document outlines metrics instrumentation for the service using the "4 golden signals" framework, to help us track and improve system health and performance.
Analysis
Summary
The service is written in Rust and already contains some OpenTelemetry tracing instrumentation.
It needs to be relatively fast, its SLA says that it expects a single instance being able to process 1000 (one thousand) messages per second. There aren't currently "minimum hardware requirements" documented for reaching that throughput.
There is no expectation that these systems will be run in hardware constrained environments, so there is no need to be particularly concerned with the hardware costs of collecting metrics. In all cases, the collection and management of metrics should be out of the critical path of a journey. A metrics operation should not be required for receiving a message, or delay it from being sent to the output topic. If a metrics operation fails, another out-of-band telemetry signals should be configured to report the failure (e.g. logs, traces).
The four golden signals are latency, throughput (or traffic), errors and saturation. The aforementioned signals can be used to gauge a baseline understanding of system health and performance.
Saturation, is typically represented as "system resource usage". These are typically collected from outside of the application, for example metrics are collected from host systems (e.g. /proc), container orchestrators (kube-state-metrics) or runtimes (cAdvisor).
If more granularity is required to understand application sub-system saturation, further instrumentation can be applied; for example the network bytes sent through a client library, time (and in turn CPU cycles) spent doing garbage collections, or the number of connections in a connection pool or along with its maximum size.
Often, these kinds of saturation metrics are handled by library maintainers. The metrics exposed from cAvsior and kube-state-metrics will be sufficient to understand the "hardware" usage of the system.
In many cases, latency, error's and throughput can be represented using histograms.
Instead of implementing separate metrics for tracking calls and there latency, a single histogram outputs the _sum, _count and configurable buckets for request durations to be placed into. You can read more about Prometheus's histogram metrics at prometheus.io/docs/concepts/metric_types or OpenTelemetry metrics at opentelemetry.io/docs/specs/otel/metrics/data-model/.
Calls with latency histograms that result in errors can be distinguished from successful requests using labels (aka attributes), for more information on labels see prometheus.io/docs/concepts/data_model (or attributes at opentelemetry.io/docs/specs/otel/metrics/data-model/).
At this point we should answer the question; What metrics framework should we use to instrument that application? Prometheus, or OpenTelemetry?
While having similar data types, labels (or attributes) and methods of collecting metrics, there is one way they differ greatly.
Compatibility.
Our environment is built for services to expose metrics via a Prometheus endpoint. The opentelemetry-rust project is deprecating the OTLP-Prometheus crate and no alternative has been provided.
The reasons for why we prefer pull over push are not relevant to this document, but the fact we do forces us to instrument with the Prometheus client libraries until the opentelemetry-rust project decides to start supporting a Prometheus exporter.
Neither framework provides packages for instrumenting the Kafka or Postgres clients automatically.
The Kafka (rdkafka) library has a comprehensive set of client side metrics (rdkafka::client::trait::ClientContext) that can be collected periodically.
The Postgres library (deadpool postgres) does not have an statistic API like rdkafka. A query wrapper function should be written to capture Postgres request statistics.
Tokio can be insturmented with the tokio-metrics crate.
Tasks and States
Chronos can be broken into tasks and states. The tasks are run periodically to transition messages through the various states.
Tasks
When Chronos starts, it spawns 3 Tokio tasks;
- Consume - Reads messages from the input queue, then store them for later or send them directly to the output if there scheduled time is up
- Produce - Reads messages from the database, collect any that need to be forwarded soon, then forward them to Kafka.
- Monitor - Checks for messages marked as "being delivered", but not cleaned from the database. After a configurable period of time, Chronos will retry messages in this state assuming they were not delivered successfully
These 3 tasks are run until one of them returns an exception, at which point the program will exit.
We will explore the Consume and Produce tasks in more depth in the "states" section, for now, but first we will quickly cover the instrumentation required for the "Monitor" task, Chronos's error correction system.
It periodically polls the database to look for message IDs that appear to be have been sent but not been deleted from the database. If it finds any ID's, it sets the records "readied_at" and "readied_by" fields to null, allowing the message to be reset on the next poll.
We should track the latency of the select and update database operations, as well as the number of messages we have to reset with the monitoring task. It is important that we are made aware when we detect high levels of send failures.
States
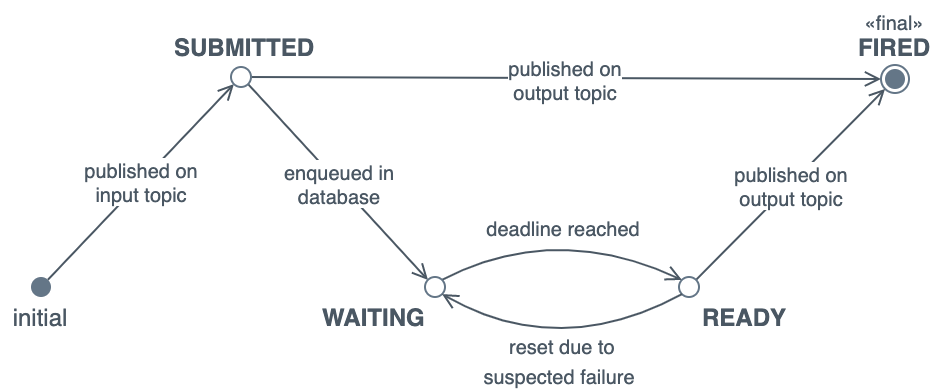
The Chronos documentation contains several states that the service enters. These states can be inferred through instrumentation of Chronos, and surrounding applications and infrastructure:
-
Submitted
This is about understanding the input queue.
We will want to know:
- The number of messages submitted to the service (queue total)
- The number of messages submitted but not actioned (queue depth)
- How long messages are spending in the queue before being actioned (queue time)
The submitted state transitions to the waiting and fired state.
We will want to know how many message transition to each state, and how long these operations take.
Practically speaking, this means recording the duration of calls to send messages to Postgres or Kafka.
We must count any exceptions we encounter when publishing to either of the downstream services.
Messages that transition from submitted to fired immediately should not affect the "jitter" SLA, as clients can attach arbitrary timestamps to the message.
-
Waiting
This is about understanding what is inside your database.
We can't practically track how many messages are awaiting processing in the database without querying it.
To avoid overloading the service, we can use tools like SQL exporter to offload the overhead of generating database table statistics to an external process.
Additional exporters like the Cloud Native Postgres exporter or Prometheus PostGres exporter can be installed to obtain more details about the state of the Postgres service and databases.
We can count how many records transition from the waiting to the ready state when we mark them as ready with the output of the "ready_to_fire_db" function.
-
Ready
Messages are marked for delivery (chronos_bin/src/postgres/pg.rs::Pg::ready_to_fire_db()) , sent to Kafka (chronos_bin/src/kafka/producer.rs::KafkaProducer::kafka_publish()), then deleted from the database (chronos_bin/src/postgres/pg.rs::Pg::delete_fired()).
Each of those function and the processor worker loop (chronos_bin/src/message_processor.rs::MessageProcessor::processor_message_ready()) should have its latency and a boolean label showing if the operation was successful.
An additional "jitter" metric must be collected after publishing the message. As we expect our "jitter" p90 to be 500ms, we should explicitly set a bucket there, so we can count the number of requests under/over this limit.
-
Fired
As messages in this state are already deleted from the Chronos database, responsibility for the message has shifted to downstream consumers.
There isn't anything further to instrument here.
Metrics
The following is a non-exhaustive list of metrics for Chronos.
Metric and dimension names can be changed when implemented if need be:
| name |
type |
dimensions |
description |
| msg_consume_latency |
histogram |
destination, status |
The duration of the chronos_bin/src/message_receiver.rs::MessageReceiver::handle_message(). We must be able to filter by destination (kafka/postgres) and the status of the operation (pass/fail). |
| msg_process_latency |
histogram |
returned, status |
The duration of message processor loops (chronos_bin/src/message_processor.rs::MessageProcessor::processor_message_ready). We must be able to filter out loops returned tasks to trigger as this will effect latency. We must also return whether the loop completed successfully or not. |
| msg_wait_time |
histogram |
|
How long a message has spent waiting in the input queue. For this to work effectively Kafka must set the message timestamp |
| msg_jitter |
histogram |
|
Tracks the jitter of messages when being published to the output topic. This is the difference between the timestamp immediately after processing the message and the time requested by the client. As the documentation outlines an SLA of 500ms, we should explicitly define a bucket for this. |
| msg_reset |
counter |
|
The number of records reset by chronos_bin/src/postgres/pg.rs::Pg::reset_to_init_db() |
Summary
Chronos is a service written in Rust that ingests messages from a queue and republishes them at some point in the future.
Clients provide a timestamp of when they would like the message re-published. The message is typically stored in a database until the timestamp rolls around, where it's then placed onto the output queue.
To increase throughput, distributed compute resources, and to remove a single point of failure, multiple replicas are run.
Because the Chronos workers are distributed, there are additional locking and error handling primitives built in to detect when other instances have failed to deliver a message.
When it is performing correctly we expect;
This document outlines metrics instrumentation for the service using the "4 golden signals" framework, to help us track and improve system health and performance.
Analysis
Summary
The service is written in Rust and already contains some OpenTelemetry tracing instrumentation.
It needs to be relatively fast, its SLA says that it expects a single instance being able to process 1000 (one thousand) messages per second. There aren't currently "minimum hardware requirements" documented for reaching that throughput.
There is no expectation that these systems will be run in hardware constrained environments, so there is no need to be particularly concerned with the hardware costs of collecting metrics. In all cases, the collection and management of metrics should be out of the critical path of a journey. A metrics operation should not be required for receiving a message, or delay it from being sent to the output topic. If a metrics operation fails, another out-of-band telemetry signals should be configured to report the failure (e.g. logs, traces).
The four golden signals are latency, throughput (or traffic), errors and saturation. The aforementioned signals can be used to gauge a baseline understanding of system health and performance.
Saturation, is typically represented as "system resource usage". These are typically collected from outside of the application, for example metrics are collected from host systems (e.g. /proc), container orchestrators (kube-state-metrics) or runtimes (cAdvisor).
If more granularity is required to understand application sub-system saturation, further instrumentation can be applied; for example the network bytes sent through a client library, time (and in turn CPU cycles) spent doing garbage collections, or the number of connections in a connection pool or along with its maximum size.
Often, these kinds of saturation metrics are handled by library maintainers. The metrics exposed from cAvsior and kube-state-metrics will be sufficient to understand the "hardware" usage of the system.
In many cases, latency, error's and throughput can be represented using histograms.
Instead of implementing separate metrics for tracking calls and there latency, a single histogram outputs the _sum, _count and configurable buckets for request durations to be placed into. You can read more about Prometheus's histogram metrics at prometheus.io/docs/concepts/metric_types or OpenTelemetry metrics at opentelemetry.io/docs/specs/otel/metrics/data-model/.
Calls with latency histograms that result in errors can be distinguished from successful requests using labels (aka attributes), for more information on labels see prometheus.io/docs/concepts/data_model (or attributes at opentelemetry.io/docs/specs/otel/metrics/data-model/).
At this point we should answer the question; What metrics framework should we use to instrument that application? Prometheus, or OpenTelemetry?
While having similar data types, labels (or attributes) and methods of collecting metrics, there is one way they differ greatly.
Compatibility.
Our environment is built for services to expose metrics via a Prometheus endpoint. The opentelemetry-rust project is deprecating the OTLP-Prometheus crate and no alternative has been provided.
The reasons for why we prefer pull over push are not relevant to this document, but the fact we do forces us to instrument with the Prometheus client libraries until the opentelemetry-rust project decides to start supporting a Prometheus exporter.
Neither framework provides packages for instrumenting the Kafka or Postgres clients automatically.
The Kafka (rdkafka) library has a comprehensive set of client side metrics (rdkafka::client::trait::ClientContext) that can be collected periodically.
The Postgres library (deadpool postgres) does not have an statistic API like rdkafka. A query wrapper function should be written to capture Postgres request statistics.
Tokio can be insturmented with the tokio-metrics crate.
Tasks and States
Chronos can be broken into tasks and states. The tasks are run periodically to transition messages through the various states.
Tasks
When Chronos starts, it spawns 3 Tokio tasks;
These 3 tasks are run until one of them returns an exception, at which point the program will exit.
We will explore the Consume and Produce tasks in more depth in the "states" section, for now, but first we will quickly cover the instrumentation required for the "Monitor" task, Chronos's error correction system.
It periodically polls the database to look for message IDs that appear to be have been sent but not been deleted from the database. If it finds any ID's, it sets the records "readied_at" and "readied_by" fields to null, allowing the message to be reset on the next poll.
We should track the latency of the select and update database operations, as well as the number of messages we have to reset with the monitoring task. It is important that we are made aware when we detect high levels of send failures.
States
The Chronos documentation contains several states that the service enters. These states can be inferred through instrumentation of Chronos, and surrounding applications and infrastructure:

Submitted
This is about understanding the input queue.
We will want to know:
The submitted state transitions to the waiting and fired state.
We will want to know how many message transition to each state, and how long these operations take.
Practically speaking, this means recording the duration of calls to send messages to Postgres or Kafka.
We must count any exceptions we encounter when publishing to either of the downstream services.
Messages that transition from submitted to fired immediately should not affect the "jitter" SLA, as clients can attach arbitrary timestamps to the message.
Waiting
This is about understanding what is inside your database.
We can't practically track how many messages are awaiting processing in the database without querying it.
To avoid overloading the service, we can use tools like SQL exporter to offload the overhead of generating database table statistics to an external process.
Additional exporters like the Cloud Native Postgres exporter or Prometheus PostGres exporter can be installed to obtain more details about the state of the Postgres service and databases.
We can count how many records transition from the waiting to the ready state when we mark them as ready with the output of the "ready_to_fire_db" function.
Ready
Messages are marked for delivery (chronos_bin/src/postgres/pg.rs::Pg::ready_to_fire_db()) , sent to Kafka (chronos_bin/src/kafka/producer.rs::KafkaProducer::kafka_publish()), then deleted from the database (chronos_bin/src/postgres/pg.rs::Pg::delete_fired()).
Each of those function and the processor worker loop (chronos_bin/src/message_processor.rs::MessageProcessor::processor_message_ready()) should have its latency and a boolean label showing if the operation was successful.
An additional "jitter" metric must be collected after publishing the message. As we expect our "jitter" p90 to be 500ms, we should explicitly set a bucket there, so we can count the number of requests under/over this limit.
Fired
As messages in this state are already deleted from the Chronos database, responsibility for the message has shifted to downstream consumers.
There isn't anything further to instrument here.
Metrics
The following is a non-exhaustive list of metrics for Chronos.
Metric and dimension names can be changed when implemented if need be: