Author: Yinhui Yang(Kami)
Regarding this project, we will analyze total fifteen datasets (Datasets: trends_up_to_....csv whcih included twelve files, Most+Recent+Cohorts+(Scorecard+Elements).csv, CollegeScorecardDataDictionary-09-08-2015.csv, id_name_link.csv) The data set used in this analysis is composed of information from the college scorecard and all Google trend data files. The trend index of each organization is standardized and examined on a monthly and college-level using Google data. From the data file of the college scorecard, I mainly used the organization that awarded the bachelor's degree and a variable that distinguished the high-income and low-income colleges as the average of all the median incomes of students after graduation, which was about $ 42,116.98 dollars. The rationale for using the mean amount instead of the median value is that when calculating this variable takes into consideration all of the median income in the colleges' calculation, and I believe that this is the best metric to distinguish between high-earning and low-earning.
According to the Google trend data file, I utilized the dates connected to university terms, Google search, and the indexes they gave from the Google trend data file at first. The average value is removed from each keyword group's index and divided by the index's standard deviation, resulting in a standardization of the index values. Second, I computed the total of standardized indexes using the average value of each college's monthly standardized index, and finally located the variable "index tot" in the data set. Finally, to generate the binary "College Scorecard" variable, I assigned 1 to all data rows linked to the time period after September 2015, and 0 to all data rows connected to the time period during or before the September 2015 release of the College Scorecard.
Since the data gathered from March 31, 2013, to March 26, 2016, is included in the outcome data set utilized in this research. I constructed two dummy variables to indicate the income of high-income and low-income college graduate students, using the comprehensive index data of 1785 from organizations and the time variable. Lastly, data preparatory and post the college scorecard indicate data before and after the university scorecard release.
The College Scorecard isn’t just data for us - it’s also treatment! The College Scorecard is a public-facing website that contains important information about colleges, including how much its graduates earn. This information has traditionally been very difficult to find.
The College Scorecard was released at the start of September 2015. Among colleges that predominantly grant bachelor’s degrees, did the release of the Scorecard shift student interest to high-earnings colleges relative to low-earnings ones (as proxied by Google searches for keywords associated with those colleges)?
The major regression Model1 that will be investigated in order to address this research question examines the effect of the College Scorecard's release on the interest in high-earning graduate students VS low-earning graduate students, as well as assessed by Google searches for college-related keywords. To begin with, it returns the influence of high-income colleges relative to low-income colleges based on Google searches for keywords related to these colleges, and the interactive influence is based on the relationship between the publication of college scorecards and how students' interest in high-earning colleges compares to low-earning colleges, so the model includes the interaction between college scorecard and high-income colleges. Second, because the effects of the college scorecard are dependent on the level of time variables, the model includes the interaction between time and college scorecard variables. These variables are interdependent and must be included in the model.
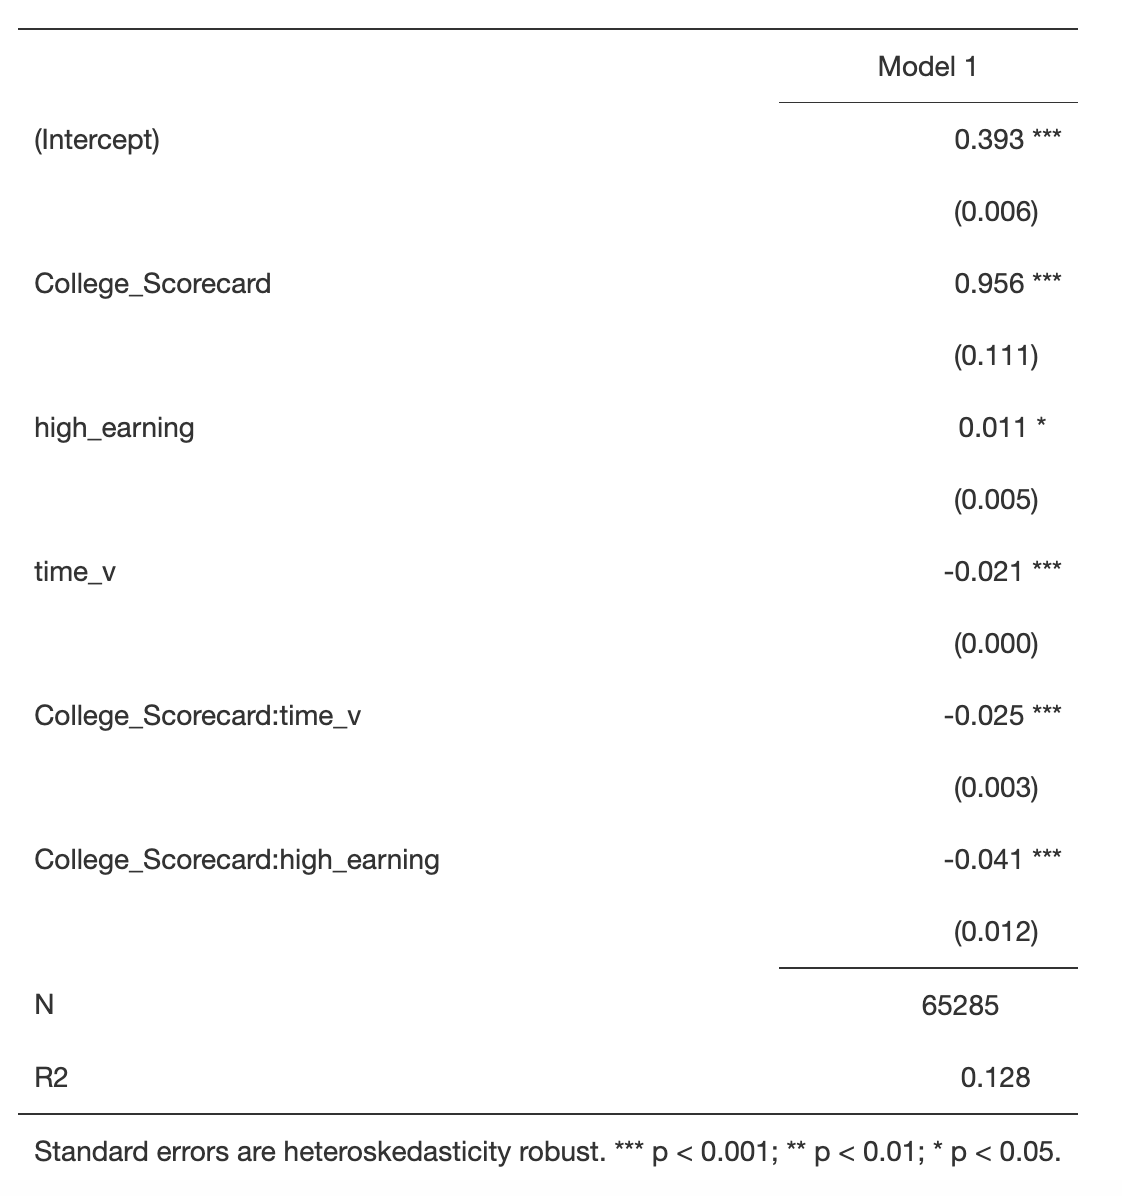
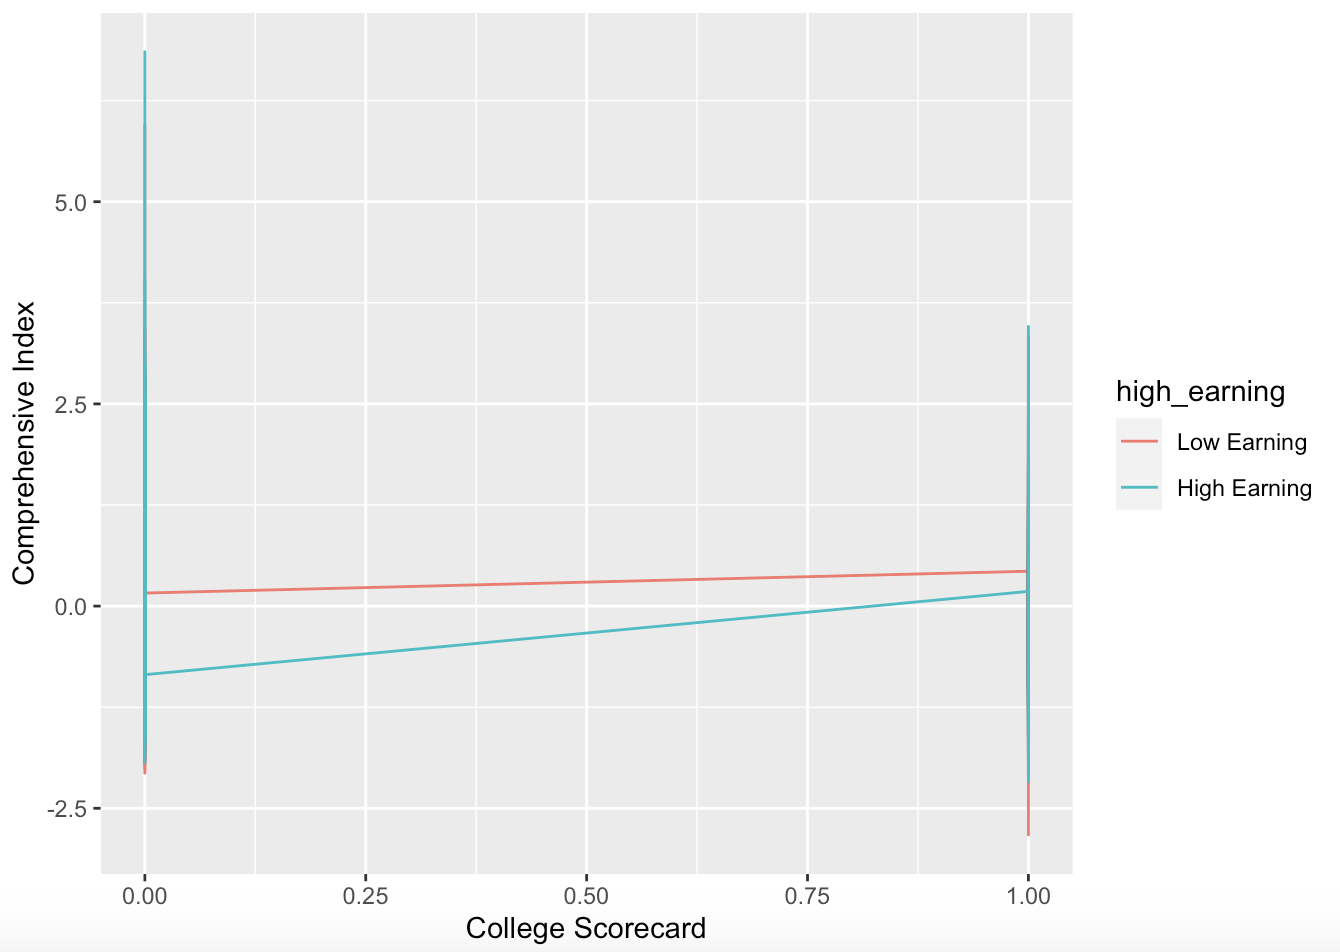
The effect between high-earning college graduate students and low-earning college graduate students after graduation on the comprehensive Google Trend Index showed an increase in College Scorecard over time, but statistically significant positive effect of 0.011. A one-month deferral reduces the comprehensive Google Trend Index by 0.021. The cumulative effect of the College Scorecard and one month decreases in time lower the comprehensive Google Index by 0.025 points more than if the College Scorecard had not been issued and time had increased by one month. Finally, the College Scorecard has caused a 0.041 drop in the complete Google Trend index for high-earning college graduate students compared to low-earning college graduate students since its publication. The release of the College Scorecard for low-earning groups resulted in an average Google Trends index of 1.349.
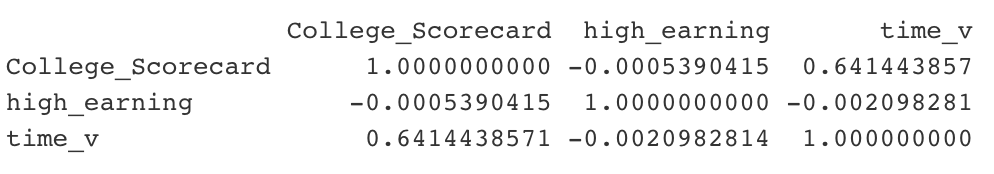
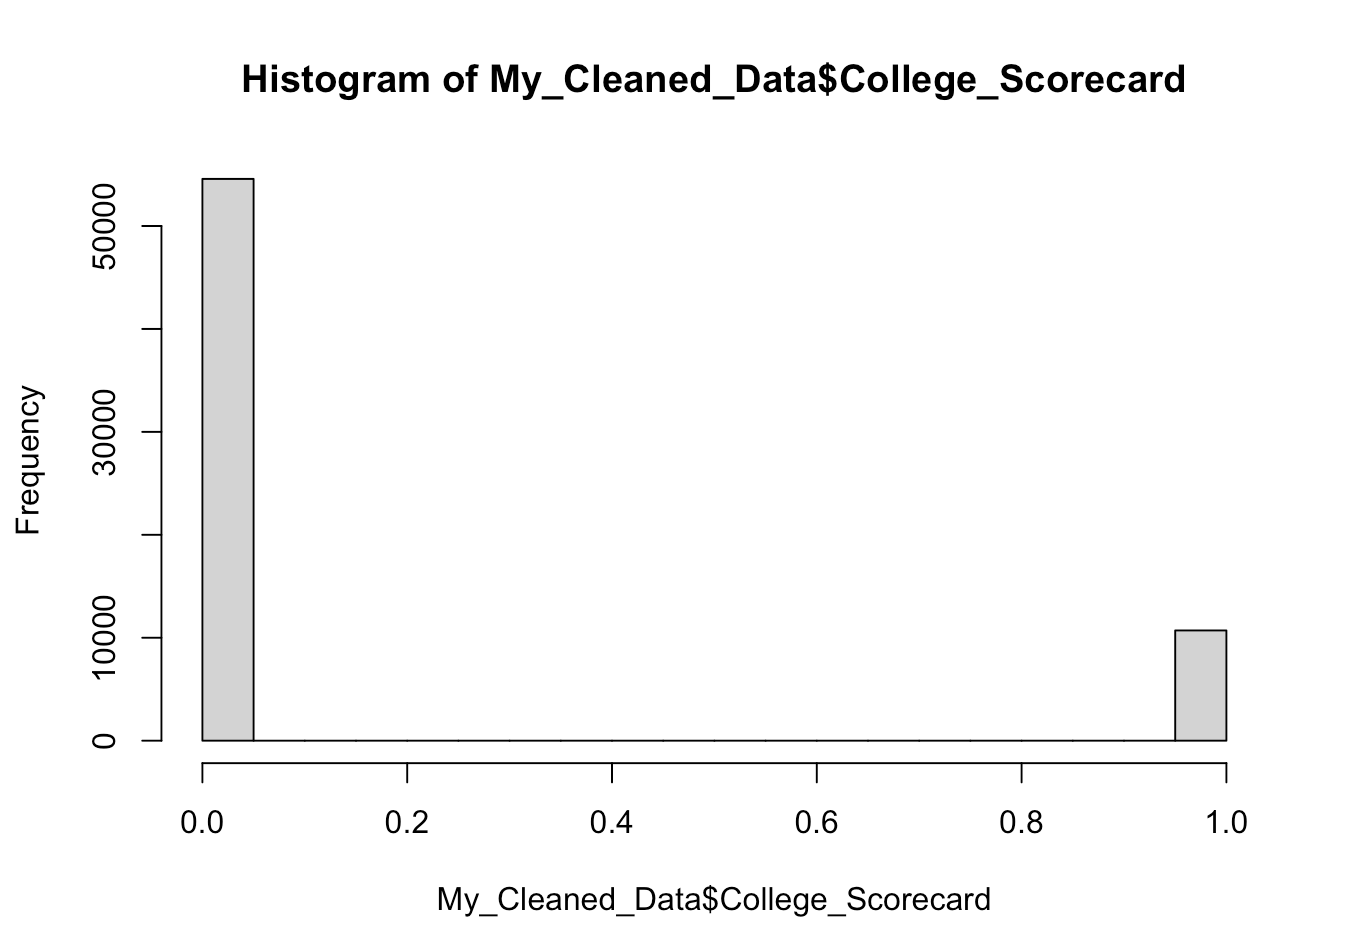
For the summary statistics, the standard deviation for index tot in the data set is 0.5791552. Then I looked up the correlation between my model's independent variables and found a significant positive correlation coefficient of 0.6414438571 between Time and College Scorecard, indicating that the interaction term in my model is legitimate. At the same time, I also run a histogram for the College Scorecards variables used in regression analysis, in order to determine their distribution in the data set. One thing that caught my attention was that the timeline of this data set from 2013 to 2016, the variable College Scorecard return as imbalanced after anaylsis, and the data before the release of the College Scorecard was oversampled within this data set .