- 개요
- 실습
- 설정
- rqt_graph
- ros2 topic list
- ros2 topic echo
- ros2 topic info
- ros2 interface show
- ros2 topic pub
- ros2 topic hz
- 종료하기
- ROS 2 topics에 대한 개념을 이해하기 위해서 rqt_graph와 CLI 도구 사용하는 방법을 이해해야 한다.
- ROS 2에서는 시스템은 모듈화된 여러 nodes로 구성
- topics = bus
- 각 node가 data를 교환하는 bus (아래 그림)

- node는 여러 data를 동시에 publish/subscribe가 가능하다. (아래 그림)
- nodes 사이에 data를 이동시키는 가장 일반적인 방법
-
turtlesim을 실행해보자.
-
새 터미널에서 아래 명령 실행하기
ros2 run turtlesim turtlesim_node- 새 터미널에서 아래 명령 실행하기
ros2 run turtlesim turtle_teleop_key-
rqt_graph 사용 목적
- nodes와 topics의 변화를 시각화
-
rqt_graph 실행하는 명령
rqt_graph- rqt를 이용한 rqt_graph 여는 방법
- Plugins > Introspection > Node Graph

- Quiz :
- node는?
- topics은?
- 현재 ROS 2 시스템에서 실행 중인 모든 topics 목록 보는 명령
- 새 터미널에서 ros2 topic list 명령 실행하기
ros2 topic list- 결과
/parameter_events
/rosout
/turtle1/cmd_vel
/turtle1/color_sensor
/turtle1/pose
- topics과 그 type을 보는 명령
ros2 topic list -t- 결과
/parameter_events [rcl_interfaces/msg/ParameterEvent]
/rosout [rcl_interfaces/msg/Log]
/turtle1/cmd_vel [geometry_msgs/msg/Twist]
/turtle1/color_sensor [turtlesim/msg/Color]
/turtle1/pose [turtlesim/msg/Pose]
- 특정 topic에서 publish되는 data 확인하는 명령 형태
ros2 topic echo <topic_name>- /teleop_turtle node가 /turtle1/cmd_vel topic으로 data를 publish한다는 것을 알고 있으므로
- 이 topic으로 publish data 보는 명령
ros2 topic echo /turtle1/cmd_vel-
data를 확인하려면 /turtle_teleop_key 가 실행되고 있어야 하고 이 창에서 키보드 화살표를 움직여보자.
-
결과
linear:
  x: 2.0
  y: 0.0
  z: 0.0
angular:
  x: 0.0
  y: 0.0
  z: 0.0
  ---
- Hide -> Debug 체크박스 해하기
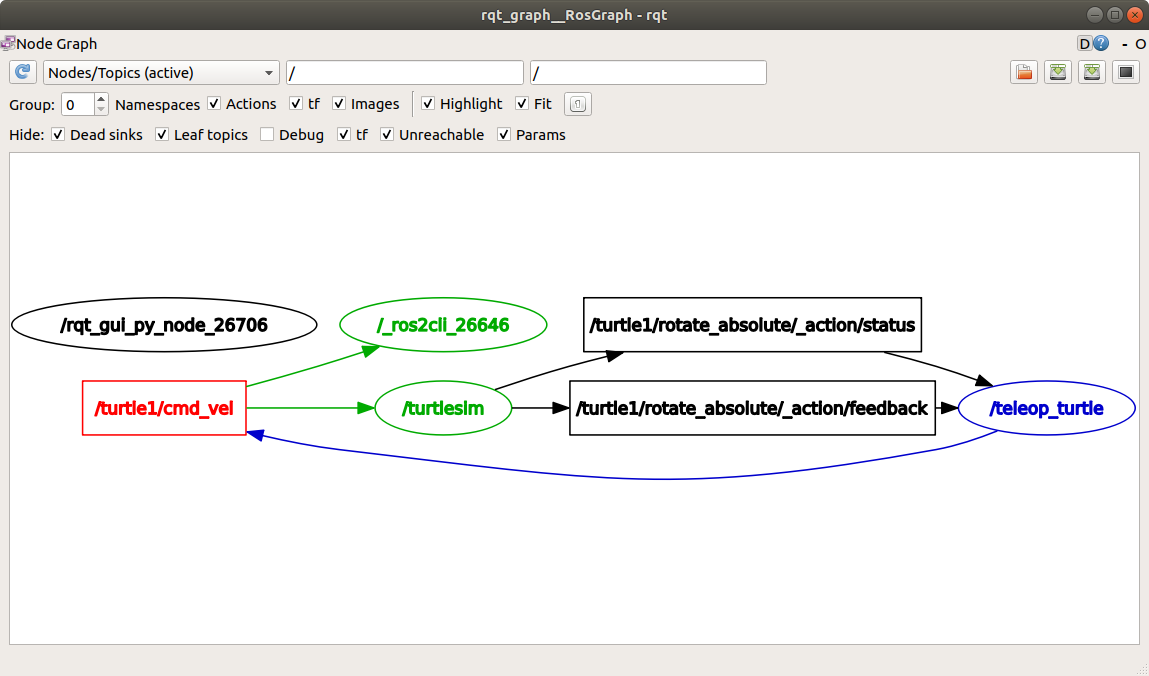
- 위 그림에서 /_ros2cli_26646 는 echo 명령으로 생성된 node
- /turtle1/cmd_vel topic으로 publish되는 data를 2개 node에서 subscribe하고 있다.(/turtlesim, /_ros2cli_26646 node)
-
topic은 1:1, 1:n, n:1, n:n 이 가능하다.
-
현재 실행중인 topic 정보(publisher와 subscriber 개수) 확인하는 명령
ros2 topic info /turtle1/cmd_vel- 결과
Type: geometry_msgs/msg/Twist
Publisher count: 1
Subscription count: 2
-
node는 topics 상에 data를 전송할 때 messages를 사용한다.
-
publisher와 subscriber는 항상 동일한 type의 message를 주고 받는다.
-
위에 ros2 topic list -t 명령을 실행했는데 여기서 topic type을 볼 수 있었다.
-
cmd_vel topic은 아래와 같은 type을 가진다
geometry_msgs/msg/Twist
-
해석 방법
- geometry_msgs : package 이름
- Twist라는 msg가 있다는 의미
-
type에 대한 상세 정보(메시지 구조)를 얻기 위한 명령 형태
ros2 interface show geometry_msgs/msg/Twist- 결과
# This expresses velocity in free space broken into its linear and angular parts.

    Vector3  linear
    Vector3  angular
- echo 명령 실행하기
ros2 topic echo /turtle1/cmd_vel- 결과
linear:
  x: 2.0
  y: 0.0
  z: 0.0
angular:
  x: 0.0
  y: 0.0
  z: 0.0
  ---
- 이제 메시지 구조를 알고 있으므로, 아래 명령 형태를 사용하면 topic 상으로 data를 publish할 수 있다. (''는 실제 data를 의미)
ros2 topic pub <topic_name> <msg_type> '<args>'- args는 YAML 문법을 따르면 아래 명령과 같은 형태이다.
ros2 topic pub --once /turtle1/cmd_vel geometry_msgs/msg/Twist "{linear: {x: 2.0, y: 0.0, z: 0.0}, angular: {x: 0.0, y: 0.0, z: 1.8}}"-
--once 옵션은 '1번만 message를 publish하고 종료한다'는 의미
-
결과 (출력 및 turtlesim 창)
publisher: beginning loop
publishing #1: geometry_msgs.msg.Twist(linear=geometry_msgs.msg.Vector3(x=2.0, y=0.0, z=0.0), angular=geometry_msgs.msg.Vector3(x=0.0, y=0.0, z=1.8))

- turtle이 계속 움직이게 하는 명령을 수행시킬려면 아래와 같은 명령을 수행
ros2 topic pub --rate 1 /turtle1/cmd_vel geometry_msgs/msg/Twist "{linear: {x: 2.0, y: 0.0, z: 0.0}, angular: {x: 0.0, y: 0.0, z: 1.8}}"-
--rate 1 : 1Hz로 data를 publish
-
결과

- rqt_graph 갱신한 화면(아래 그림)

- 마지막으로 echo 명령을 실행해 보자.
ros2 topic echo /turtle1/pose- 새로운 echo node가 /turtle1/pose 을 subscribe한다. (echo node : /_ros2cli_1682)
- data가 publish되는 rate를 확인하는 명령 실행하기 (pose topic publish 속도)
ros2 topic hz /turtle1/pose- 결과
average rate: 59.354
  min: 0.005s max: 0.027s std dev: 0.00284s window: 58
- Ctrl + c 키를 사용하여 동작을 종료시킨다.