Jump in distribution #5
Description
Hello!
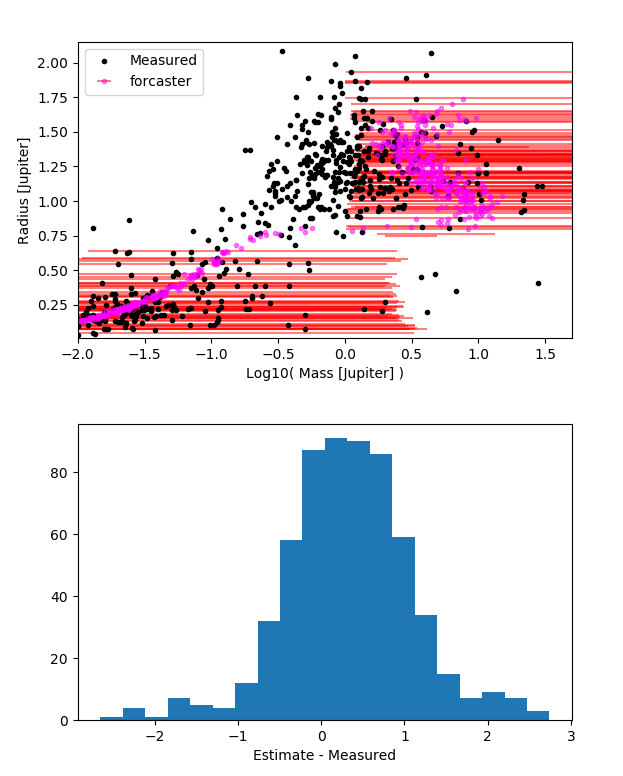
I am trying to compare a MR relationship to existing kepler data however the forecast function jumps drastically and I was wondering if I am using forecast properly?
import mr_forecast as mr
import pandas
import numpy as np
import matplotlib.pyplot as plt

def get_data(keys=['pl_pnum','pl_radj','pl_radjerr1','pl_radjerr2','pl_bmassj']):
    # query the api for the newest data
    api_url = 'https://exoplanetarchive.ipac.caltech.edu/cgi-bin/nstedAPI/nph-nstedAPI?table=exoplanets&format=json&select='
    query_url = api_url+','.join(keys)
    return pandas.read_json( query_url )

data = get_data()
nulls = ~data.isnull().any(axis=1)
data = data[nulls]

std = 0.5*(data['pl_radjerr1'] + data['pl_radjerr2'])

pred, up, low = [],[],[]
for i in range(data.shape[0]):
    if i%50 ==0:print(i)
    Mmedian, Mplus, Mminus = mr.Rstat2M(data['pl_radj'].values[i], abs(std.values[i]), unit='Jupiter', sample_size=100)
    pred.append(Mmedian)
    up.append(Mplus)
    low.append(Mminus)

up = np.array(up)
low=np.array(low)

f,ax = plt.subplots(2)
ax[0].plot( np.log10(data['pl_bmassj']),data['pl_radj'],'k.',label='Measured')
#ax.plot(np.log10(pred),data['pl_radj'],'ro')

ax[0].errorbar(np.log10(pred),data['pl_radj'] ,xerr=[np.log10(low),np.log10(up)],color='magenta',ecolor='red',alpha=0.5,fmt='.',errorevery=4,label='forcaster')
ax[0].set_xlim([-2,1.7])
ax[0].set_ylim([0.01,2.15])
ax[0].set_xlabel('Log10( Mass [Jupiter] )')
ax[0].set_ylabel('Radius [Jupiter]')

ax[1].hist( np.log10(pred) - np.log10(data['pl_bmassj']),bins=20)
ax[1].set_xlabel('Estimate - Measured')

plt.show()