-
Notifications
You must be signed in to change notification settings - Fork 1
Expand file tree
/
Copy pathbasics.qmd
More file actions
111 lines (72 loc) · 5.53 KB
/
basics.qmd
File metadata and controls
111 lines (72 loc) · 5.53 KB
1
2
3
4
5
6
7
8
9
10
11
12
13
14
15
16
17
18
19
20
21
22
23
24
25
26
27
28
29
30
31
32
33
34
35
36
37
38
39
40
41
42
43
44
45
46
47
48
49
50
51
52
53
54
55
56
57
58
59
60
61
62
63
64
65
66
67
68
69
70
71
72
73
74
75
76
77
78
79
80
81
82
83
84
85
86
87
88
89
90
91
92
93
94
95
96
97
98
99
100
101
102
103
104
105
106
107
108
109
110
111
---
title: "R Basics"
editor: visual
---
## Getting to know RStudio
When you first open RStudio, it is split into 3 panels:
- **The Console** (left), where you can directly type and run code (by hitting Enter)
- **The Environment/History pane** (upper-right), where you can view the objects you currently have stored in your environment and a history of the code you've run
- **The Files/Plots/Packages/Help pane** (lower-right), where you can search for files, view and save your plots, view and manage what packages are loaded in your library and session, and get R help
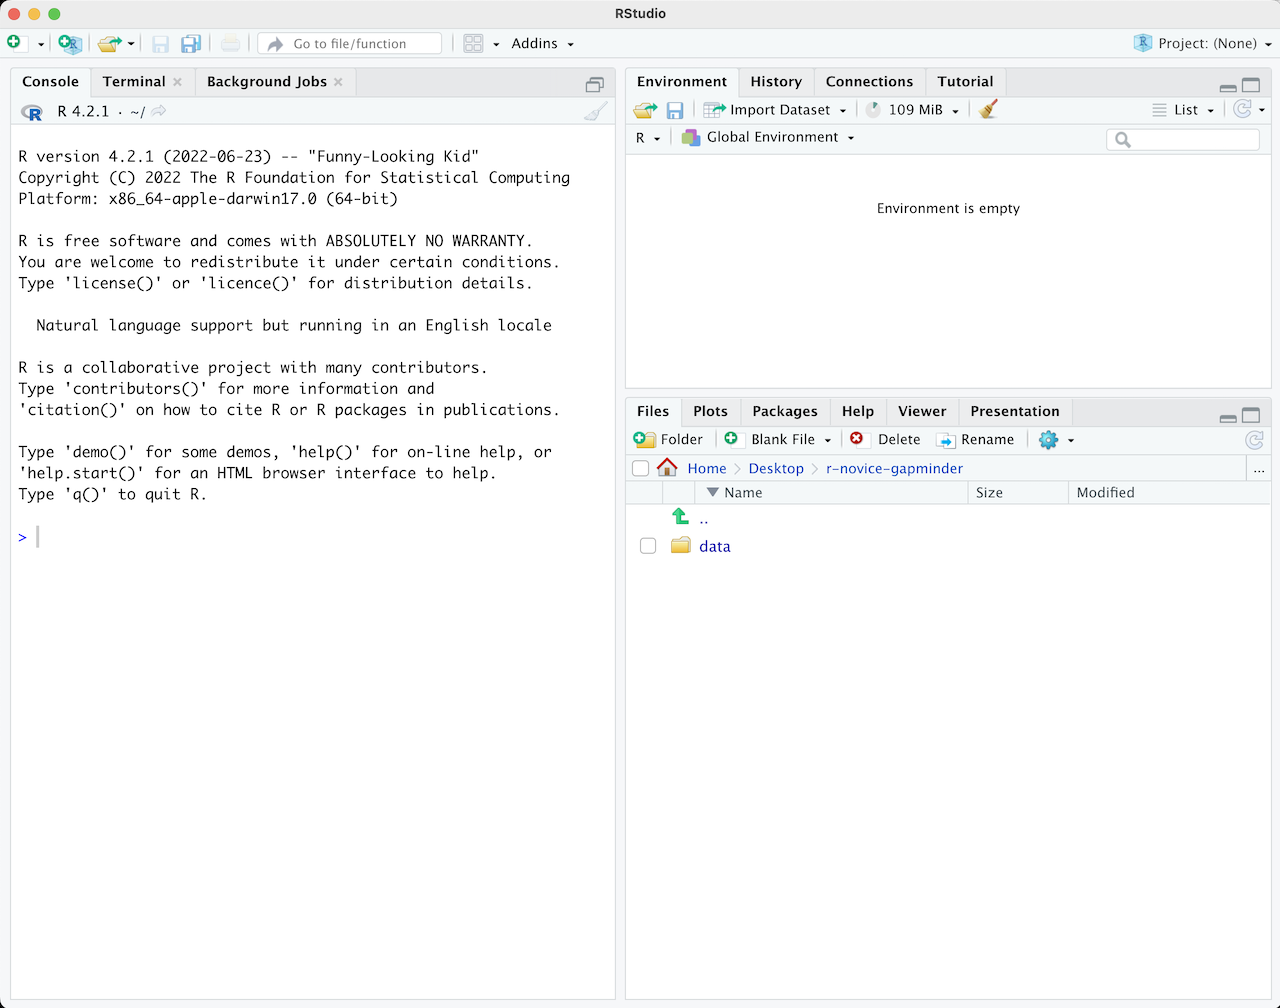{width="100%"}
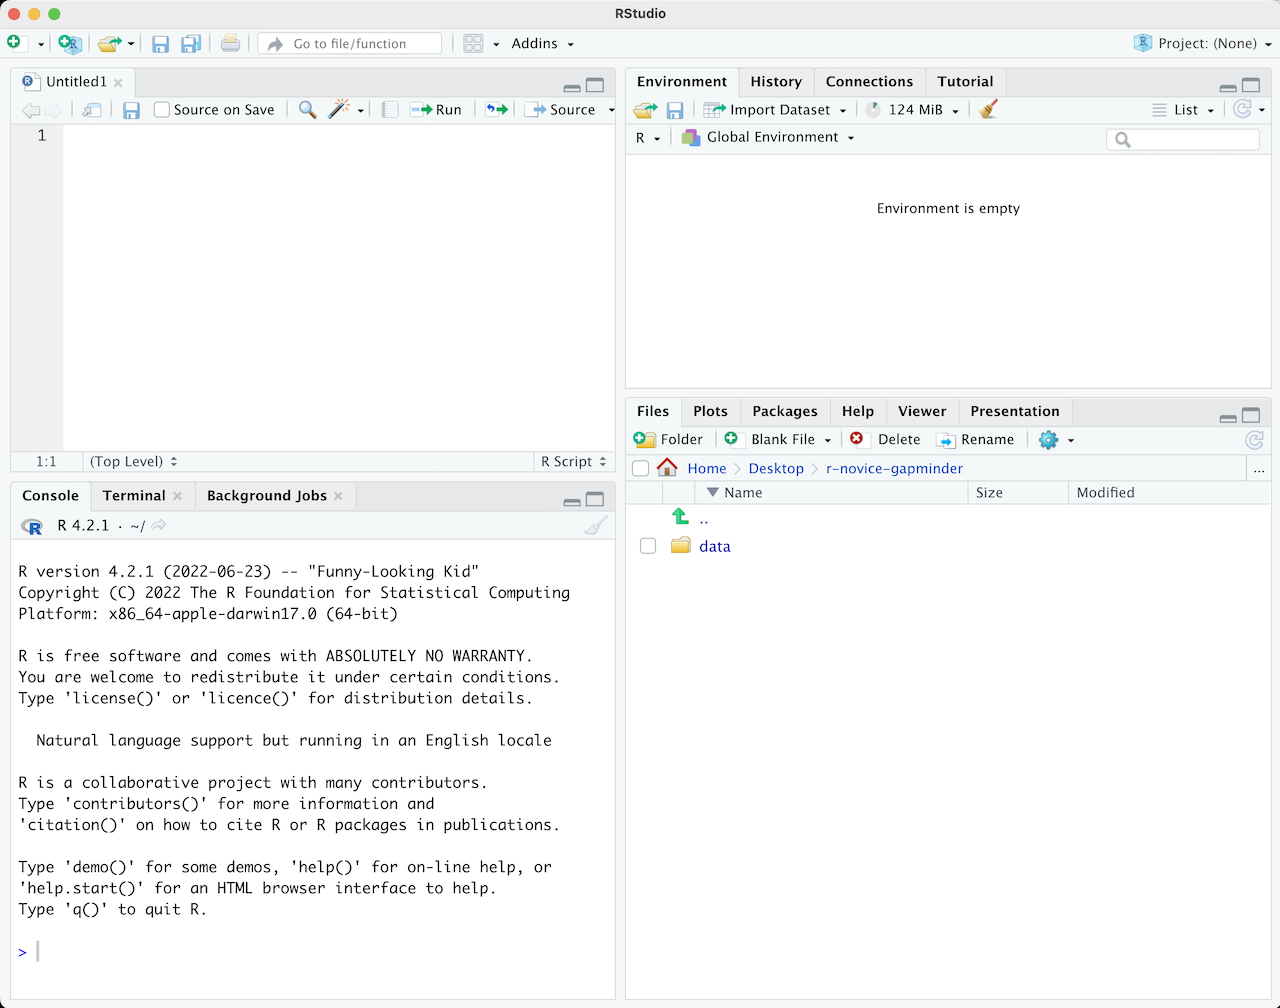
To write and save code you use scripts. You can open a new script with File -\> New File or by clicking the icon with the white square and green plus sign in the upper left corner. When you open a script, RStudio then opens a fourth **'Source' panel** in the upper-left to write and save your code. You can also send code from a script directly to the console to execute it by highlighting the code line/chunk (or place your cursor at the end of the code chunk) and hit CTRL+ENTER on a PC or CMD+ENTER on a Mac.
It is good practice to add comments/notes throughout your scripts to document what the code is doing. To do this start a line with a `#`. R knows to ignore everything after a `#`, so you can write whatever you want there.
### Functions
R has many built in functions to perform various tasks. To run these functions you type the function name followed by parentheses. Within the parentheses you put in your specific arguments needed to run the function.
```{r}
# mathematical functions with numbers
log(10)
# a range of numbers
mean(1:5)
# nested functions for a string of numbers, using the concatenate function 'c'
mean(c(1,2,3,4,5))
# functions with characters
print("Hello World")
paste("Hello", "World")
```
### Packages
R Packages include reusable functions that are not built-in with R. To use these functions, you must install the package to your local system with the `install.packages()` function. Once a package is installed on your computer you don't need to install it again. Anytime you want to use the package in a new R session you just load it with the `library()` function. Go to the [Getting Started](setup.qmd) page to walk through installing and loading the R packages needed for this workshop.
#### The Tidyverse
You may hear the word "tidy" a lot throughout this workshop, which is referring to the **Tidyverse**. The Tidyverse is a collection of R packages designed for data manipulation, exploration, and visualization that you are likely to use in every day data analysis. They all use the same design philosophy, grammar, and data structures. When you install the Tidyverse, it installs all of these packages, and you can then load all of them in your R session with `library(tidyverse)`. For this course, we are using Tidyverse packages `dplyr`, `tidyr`, and `readr` and installing them individually instead of the entire Tidyverse suite of packages. You can learn more about the Tidyverse and the packages it includes here: <https://www.tidyverse.org/>.
### For Loops
Say you have an operation/function you want to apply to multiple elements or objects. Instead of writing out the same code for each element, for loops allow you to write the code once and iterate it over some sequence of elements. For example if you want to `print()` each element of a string of numbers, the code would look like:
```{r}
#| eval: true
for (i in 1:5) {
print(i)
}
```
You can also apply for loops across character elements like this:
```{r}
#| eval: true
colors <- list("red", "blue", "green")
for (i in colors) {
print(i)
}
```
You can replace `print()` with any other function or sequence of operations. It is also common to want to store the outputs of each for loop iteration. To do this you need to first create an empty list to feed each output into. You can create an empty list with `list()`, however with for loops it is better practice to specify the size of your list. For example to create an empty list of 3 elements you would run:
```{r}
#| eval: true
temp <- vector("list", length = 3)
print(temp)
```
To index elements of a list we use double brackets `[[x]]` .
So lets say we want to get the average (using the `mean()` function) of three different sets of numbers, and save each average value. We can feed the output of our for loop into our empty list `temp` like this:
```{r}
#| eval: true
# our list of numbers
num <- list(c(1,2,3), c(5,6,7,8), c(9, 10, 11, 12))
print(num)
```
```{r}
#| eval: true
for (i in seq_along(num)) {
temp[[i]] <- mean(num[[i]])
}
print(temp)
```
## Beginner Lessons/Tutorials
If you are brand new to R (or even if you have some experience) please read/work through these beginner resources:
**Hands on Programming with R by Garrett Grolemund: [The Very Basics](https://jjallaire.github.io/hopr/basics.html)**. This covers getting started with RStudio, executing code from the console, writing functions, and working with scripts.
**Spatial Data Science with applications in R by Edzer Pebesma & Roger Bivand: [R Basics](https://keen-swartz-3146c4.netlify.app/r-basics.html#r-basics).** This covers pipes (which we will use a lot in this workshop), data structures, and how to dissect the different parts and structure of spatial data in R.
Both of the above lessons cover beginner material that will be relevant for this workshop.