Oddly, I'm not getting sensible results for GLMs using H2O. Effects for continuous factors are incorrectly looking quadratic.
Here's a simple reprex for a Poisson GLM:
library(tidyverse)
library(finPlot)
library(h2o)

h2o.init()
h2o.no_progress()

df <- h2o.importFile("https://h2o-public-test-data.s3.amazonaws.com/smalldata/prostate/prostate.csv")

predictors <- c("AGE", "RACE", "VOL", "GLEASON")
response <- "CAPSULE"

prostate_glm <- h2o.glm(family = "poisson",
                        link = "log",
                        x = predictors,
                        y = response,
                        training_frame = df,
                        lambda = 0,
                        compute_p_values = TRUE)

# Correct PD using H2O
h2o.partialPlot(prostate_glm, df, "AGE")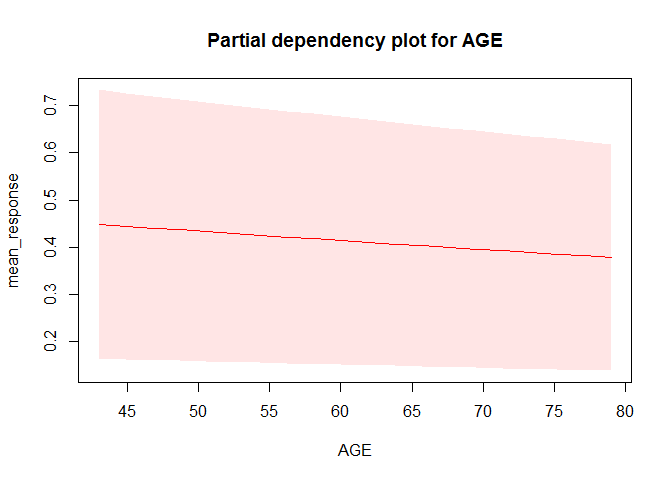
# Incorrect PD using pdp
pred.grid <- data.frame(AGE = c(43, 44.8947368421053, 46.7894736842105, 48.6842105263158,
                                50.5789473684211, 52.4736842105263, 54.3684210526316,
                                56.2631578947368, 58.1578947368421, 60.0526315789474, 61.9473684210526,
                                63.8421052631579, 65.7368421052632, 67.6315789473684, 69.5263157894737,
                                71.4210526315789, 73.3157894736842, 75.2105263157895, 77.1052631578947, 79))

pred.fun <- function(object, newdata) {
  mean(as.numeric(as.vector(h2o.predict(object, as.h2o(newdata)))))
}

pd <- pdp::partial(prostate_glm,
                   pred.var = "AGE",
                   pred.grid = pred.grid,
                   pred.fun = pred.fun,
                   train = as.data.frame(df))

autoplot(pd)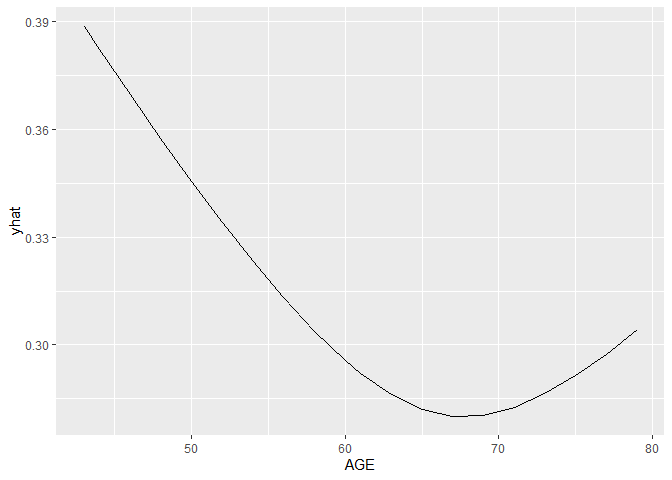
Created on 2022-11-03 by the reprex package (v2.0.1)
I'm getting similar issues with Gausian and binomial GLMs. Using version 0.8.1 from CRAN.
Oddly, I'm not getting sensible results for GLMs using H2O. Effects for continuous factors are incorrectly looking quadratic.
Here's a simple reprex for a Poisson GLM:
Created on 2022-11-03 by the reprex package (v2.0.1)
I'm getting similar issues with Gausian and binomial GLMs. Using version 0.8.1 from CRAN.