Legend on the heatmap #6
Description
Hi,
I tried to use your package in order to add a legend on my heatmap. Here my code :
d3heatmap(data_to_plot_heatmap_MANUAL_samples_log,show_color_legend=TRUE, colors = colorRampPalette(rev(brewer.pal(n = 7, name = "RdYlBu")))(100),cexCol=1,cexRow=1, labCol=colnames(data_to_plot_heatmap_MANUAL_samples_log))
Here my output :
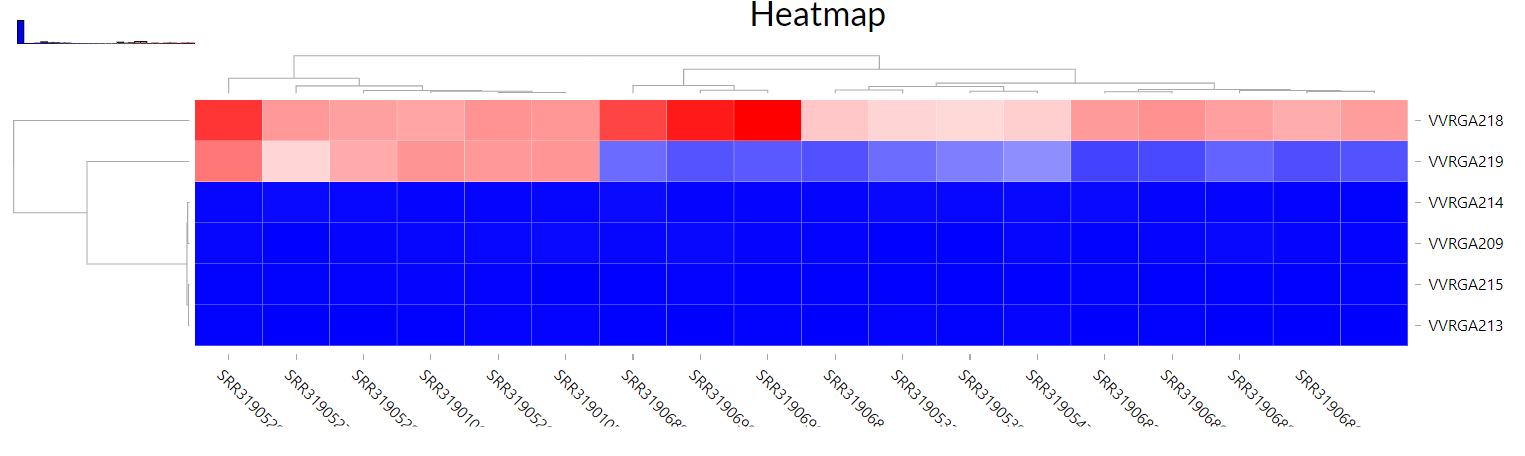
I see a "legend" but, I have no idea of the numerical value assigned at each color. In your example you have :
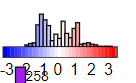
With values assigned.
Do you know what's wrong with my code?
Thank you.
Best,
Amandine