- Naming module (cannot duplicate with here )
- Naming the dataset inside module (eg. modsecurity -> audit )
- Create yml files (check modules in references). You will have directory structure like this:
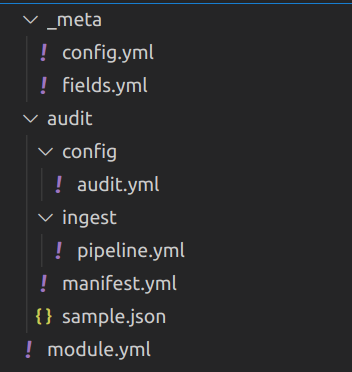
- Most setting should inside "dataset" config. In this case, it's
audit -> config -> audit.yml
In dataset config file (audit.yml here), you can decode JSON event if your whole event is encoded by JSON.
For example, an event means one on these lines of your log:
{"aaa":"bbb", "ddd":"ccc"}
{"aaa":"333", "ddd":"444"}
or each file is single event (like modsecurity audit log JSON format):
{
  "transaction": {
    "client_ip": "11.22.33.44",
    "time_stamp": "Tue Mar  8 10:34:39 2022",
  }
}
Then in your config file, you can add processors like this:
processors:
  - decode_json_fields:
      fields: [message]
      process_array: true
      target: "modsecurity"
The above setting will decode original event (which saved in field "message") into JSON, and set to variable modsecurity for further use.
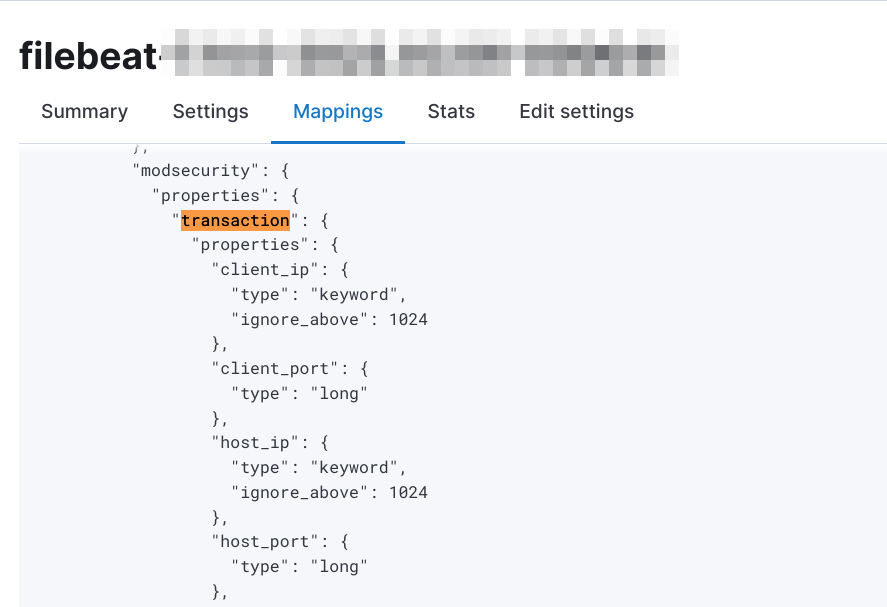
NOTE that, the whole JSON structure above will also import to Elasticsearch fields mapping of filebeat automatically. After this config, when you setup filebeat, fields mapping will like this in kibana:
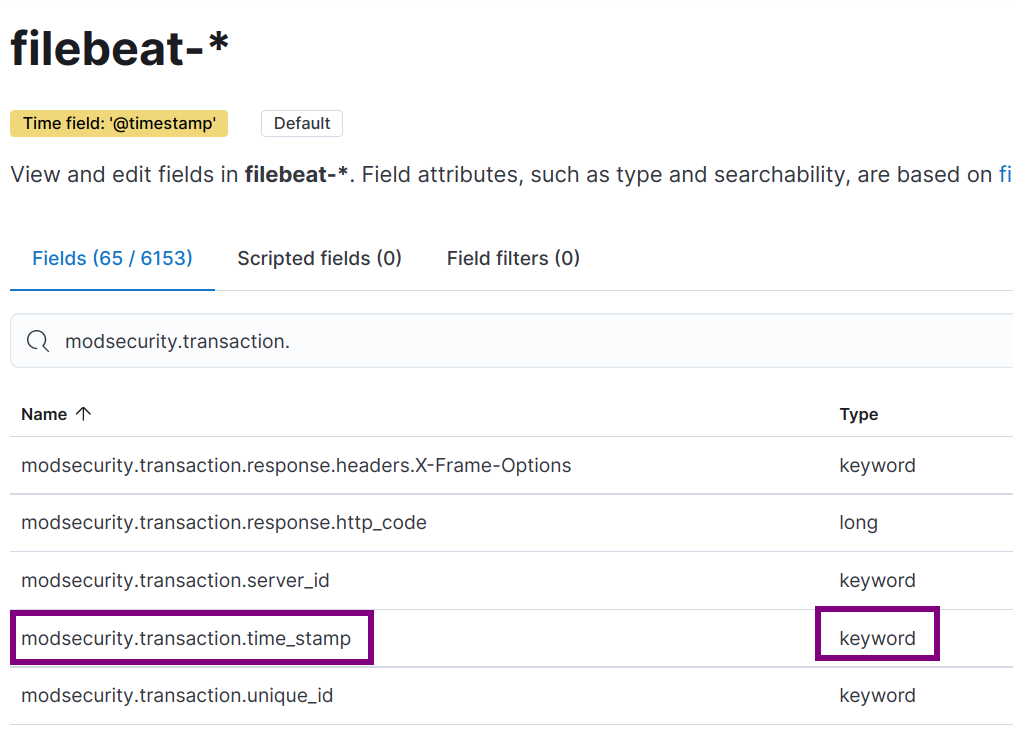
You should also check document of decode_json_fields.
Even the JSON data will be import to Elasticsearch automatically, we still want to add some pre-defined fields in Elasticsearch like IP or HTTP Status Code. Here we should define in Ingest Pipeline.
For example, in modsecurity we need to extract exactly datetime in event to save to @timestamp field of Elasticsearch. It's very important we have correct @timestamp saved in database. Which most of Kibana use this field to filter log, event, and discover.
The original datetime format of modsecurity like this:
Tue Mar 8 10:34:39 2022
Which is strange because the day of month have leading space. We need to use multiple processors in pipeline to extract field modsecurity.transaction.time_stamp.
gsub processor The date of month in modsecurity have leading space which can't be parsed by JAVA date. So we got to replace additional space by using processor gsub.
- gsub:
    field: modsecurity.transaction.time_stamp
    pattern: "  "
    replacement: " "
date processor
After replace additional space, we will have correct date format Tue Mar 8 10:34:39 2022. Elasticseach date processor can be used for mapping your date by custom defined format. In this case it's EEE MMM d HH:mm:ss yyyy. The date processor define will be like this:
- date:
    field: modsecurity.transaction.time_stamp
    formats:
    - "EEE MMM d HH:mm:ss yyyy"
But if you looked into document of date processor, default timezone will be UTC. But in modsecurity, modseucrity.transaction.time_stamp will be system timezone. We got to add timezone config in date processor. The config will be like this:
- date:
    field: modsecurity.transaction.time_stamp
    formats:
    - "EEE MMM d HH:mm:ss yyyy"
    timezone: "-0800"
This still have issue that filebeat module will be use in different machine. You shouldn't hard-coded timezone like that. After searching document, we can add system timezone into variable event.timezone when config audit.yml. Use add_locale in audit.yml will achive this:
processors:
  - add_locale: ~
  - decode_json_fields:
      fields: [message]
      process_array: true
      target: "modsecurity"
And the above date processor in ingest pipeline should written like this:
- date:
    field: modsecurity.transaction.time_stamp
    target_field: '@timestamp'
    formats:
    - "EEE MMM d HH:mm:ss yyyy"
    timezone: "{{event.timezone}}"
We also add target_field to @timestamp, then the timestamp finally correct.
For writing other ingest pipeline processors, you should check document here.
The default location of filebeat will be in /usr/share/filebeat. You need to
-
Copy your module to /usr/share/filebeat/module/modsecurity
-
Change owner and permission of module Filebeat will verify directory permission for security reason. You should use command to make sure it's correct.
sudo chown -R root:root /usr/share/filebeat/module/modsecurity
sudo chmod -R g-w /usr/share/filebeat/module/modsecurity- Create filebeat module yml setting in
/etc/filebeat/modules.d/modsecurity.yml. In case your modsecurity JSON files locate in directory/var/log/modsecurity/20220309/202203..../123123132.1231232, then the yml will be like this:
- module: modsecurity
  audit:
    enabled: true
var.paths: ["/var/log/modsecurity/**"]- Enable module by command and force-reload
sudo filebeat modules enable modsecurity
sudo /etc/init.d/filebeat force-reload- Enable debug log In case you don't know if your filebeat module enabled or not, this settings in /etc/filebeat/filebeat.yml may help you identify problem:
logging.level: debug
logging.to_files: true
logging.files:
  path: /var/log/filebeat
  name: filebeat
  keepfiles: 7
  permissions: 0644
You can check log in /var/log/filebeat/filebeat.
After enable module without error in debug log of filebeat, we can finally lode ingest pipeline into Elasticseach
sudo filebeat setup --pipelinesAfter execute above command, you will see ingest pipeline in Kibana "Stack Management -> Ingest Node Pipelines":
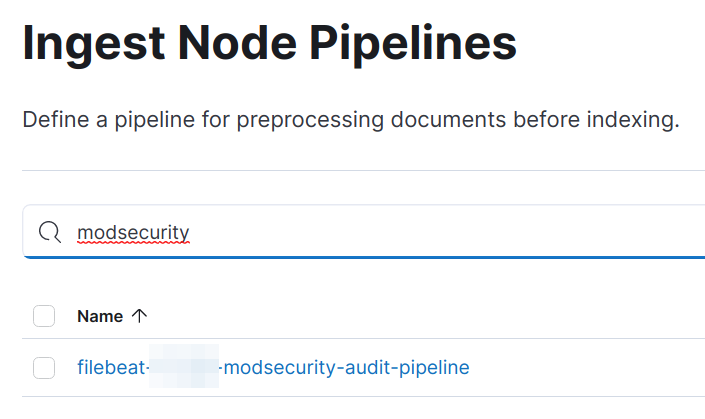
Click the line above, you can see ingest pipeline defined in module now imported.
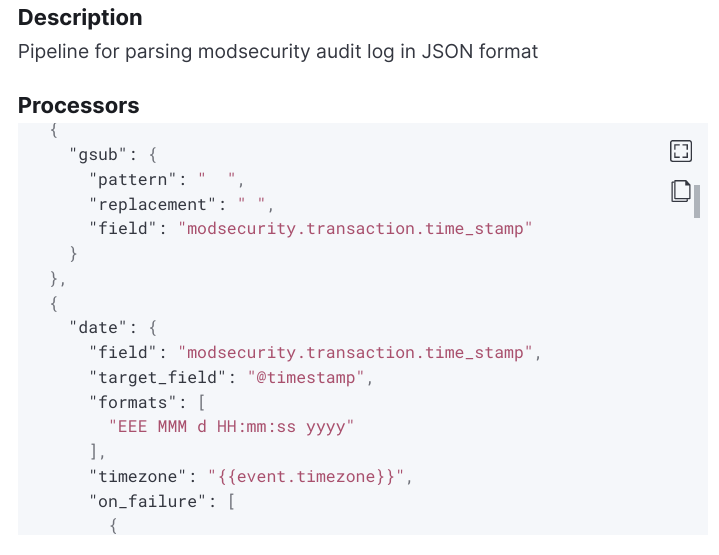
You can always delete the ingest pipeline definition above and re-import by command filebeat setup --pipelines.
In filebeat, you should check debug log. There will be log like this:
2022-03-08T22:37:39.626+0800 DEBUG [input] log/input.go:465 Check file for harvesting: /var/log/modsecurity/20220308/20220308-2201/20220308-220136-164674809611.578729 {"input_id": "2a72f7cc-cb63-4dc7-a02d-b776ac22748f"}And this:
2022-03-08T22:11:10.135+0800    DEBUG   [processors]    processing/processors.go:203    Publish event: {
  "@timestamp": "2022-03-08T14:11:10.132Z",
  "@metadata": {
    "beat": "filebeat",
    "type": "_doc",
    "version": "7.xx.0",
    "pipeline": "filebeat-xxxx-modsecurity-audit-pipeline"
  },
  "event": {
    ...
  }
}
It's means that you have success publish an event to Elasticsearch instanse.
In Elasticsearch, you should use query to check if record saved without error. Example query:
GET filebeat-*/_search
{
  "query": {
    "bool": {
      "must": [
        { "match": { "event.module":"modsecurity" } }
      ]
    }
  }
}
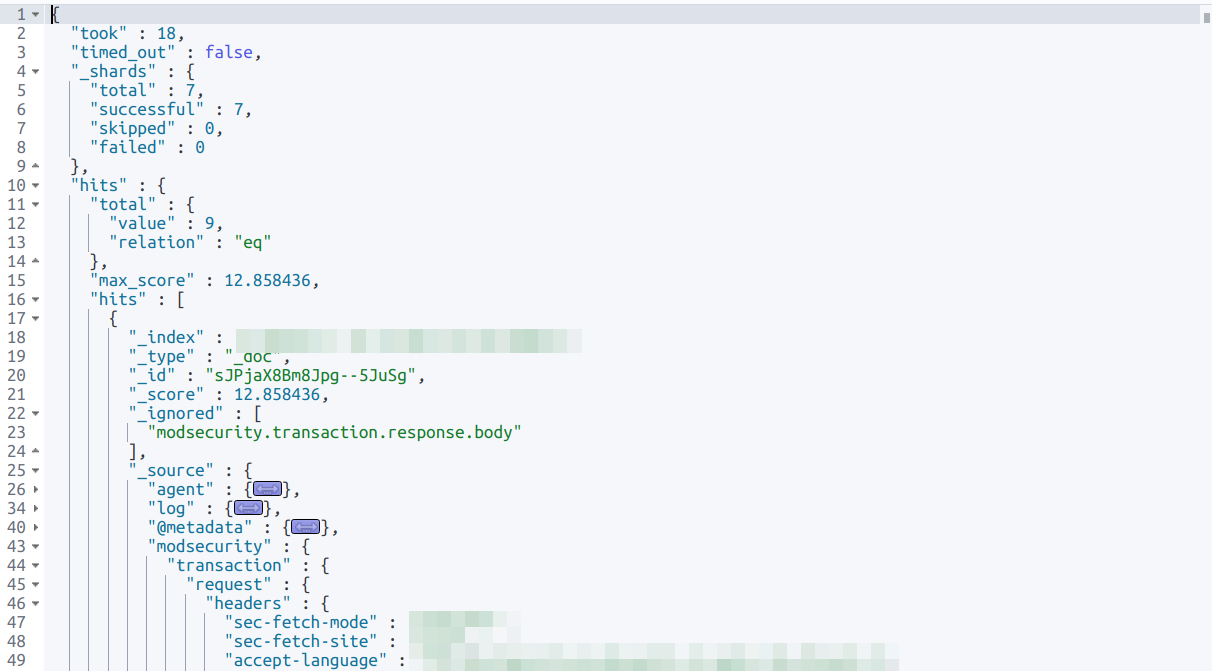
And the query result will have correct structure of your JSON data and you defined in ingest pipeline:
In Kibana, you should check your filebeat index have correct fields mapping in "Stack Management -> Index Patterns"

Adn "Index Management -> [your current index] -> Mappings"
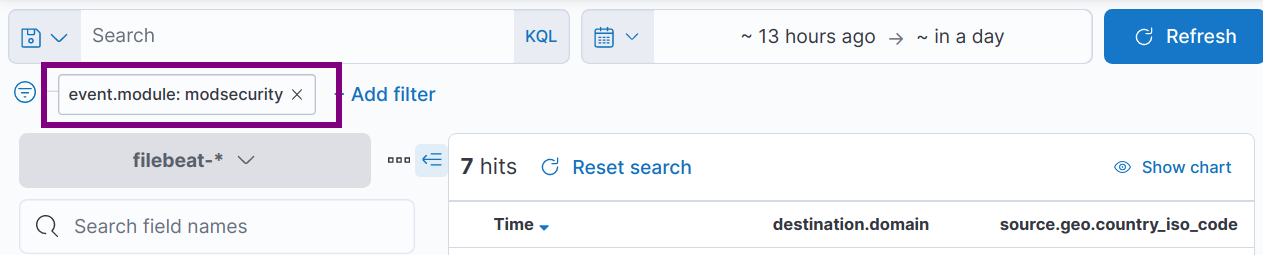
In Kibana Discover, you can now search event with filter event.module: modsecurity
Do some clear stuff to prevent further problem:
- Remember turn off debug log in /etc/filebeat/filebeat.yml
- modsecurity will periodly create directory and logs, write some cronjob to clear them. It will also prevent filebeat watch too many files.
- Practice nested query syntax in Kibana. It's helpful when you want to filter logs and building dashboard.
- In case you want to remove test logs imported above, here is quick hint
POST filebeat-*/_delete_by_query
{
  "query": {
    "term": {
      "event.module": "modsecurity"
    }
  }
}