Guides for meta-analysis spreadsheet #180
Description
Annotating meta-analysis
In pursuit of creating a transparent record of all computations undertaken during the implementation of meta-analysis and creation of the forest plots (see pulmonary-meta-analysis-2017-06-20.xlsx ), we have created a translation of the computations to be implemented in R and demonstrated this process with the R script ./sandbox/meta-analysis-demo.R and the excel companion guide pulmonary-meta-analysis-2017-07-06-guide.xlsx. The code and images to follow refer to contents of these files.
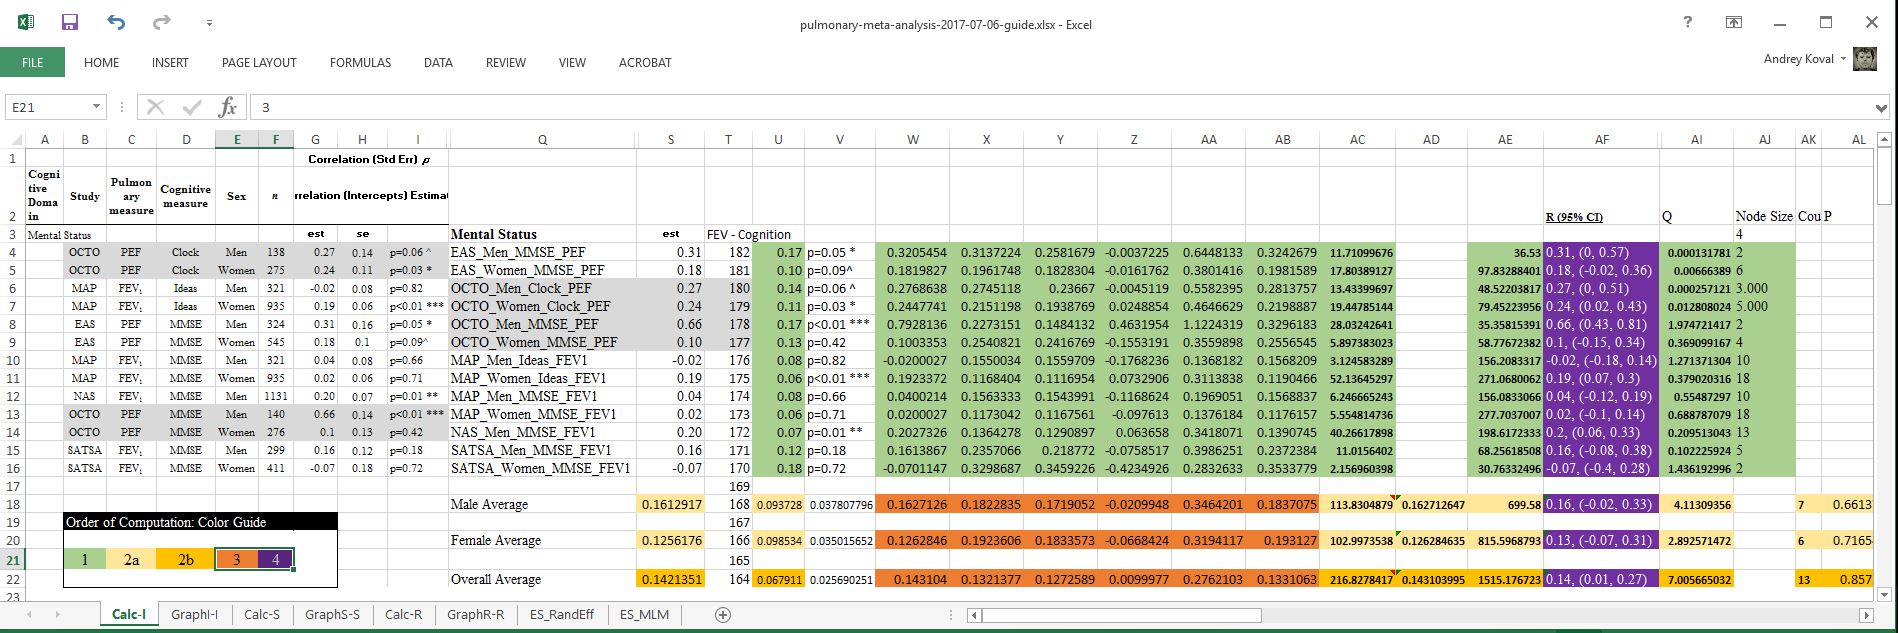
In the original spreadsheet, I have identified the cells that are actively engaged in producing the forest plot, located in the shaded area in the screenshot below

The forest plot requires the following values: estimate, confidence intervals, and node size. The tricky part is to compute these values for subgroup and overall averages, which requires additional computaion.

After cosmetic editing, we can tidy up the spreadsheet into the form that would easier to handle during annotation.

Finally, to demonstrate how the computations are carried out in R starting from the same data source, specific cells were colored to illustrate the sequence in which computations took place. The number of the sections (e.g. "1", "2a", "2b", "3") are referenced in the script ./sandbox/meta-analysis-demo.R . which details each set of operations.
This will be the main graphs referenced in this discussion.