## 改善詳細 / Details of Improvement - 陽性患者数のグラフに移動平均線を追加してほしい 東京のcovid19対策サイトのグラフには7日移動平均線が引かれています。 移動平均線があると日々の増減に惑わされずに傾向がわかるので助かります。 ## スクリーンショット / Screenshot <!-- バグであればdeveloper toolからコンソールも合わせて添付 --> <!-- If it's a bug, attach a screenshot of the developer tool console --> 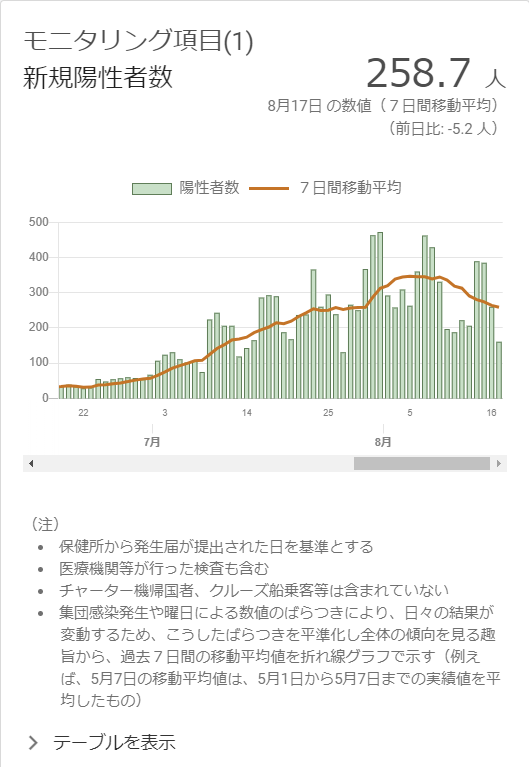 ## 期待する見せ方・挙動 / Expected behavior - 東京都と同様 ## 動作環境・ブラウザ / Environment - macOS / Windows / Linux / iOS / Android - Chrome / Safari / Firefox / Edge / Internet Explorer
改善詳細 / Details of Improvement
東京のcovid19対策サイトのグラフには7日移動平均線が引かれています。
移動平均線があると日々の増減に惑わされずに傾向がわかるので助かります。
スクリーンショット / Screenshot
期待する見せ方・挙動 / Expected behavior
動作環境・ブラウザ / Environment